Compute and interpret the correlation coefficient for the following grades of 6 students selected at random. Mathematics grade English grade 70 93 82 72 65 84 75 84 64 85 79 91 The correlation coefficient is r = (Round to three decimal places as needed.) Interpret the result. If there is a strong linear relationship, then the value of r will be close to Since the value of r in this case is to the desired value(s), there seem to be a strong linear relationship present. 1 or -1. 0. Compute and interpret the correlation coefficient for the following grades of 6 students selected at random. Mathematics grade 70 93 82 72 65 84 English grade 75 84 64 85 79 91 The correlation coefficient is r = ☐ (Round to three decimal places as needed.) Interpret the result. If there is a strong linear relationship, then the value of r will be close to Since the value of r in this case is to the desired value(s), there seem to be a strong linear relationship present. close not close
Compute and interpret the correlation coefficient for the following grades of 6 students selected at random. Mathematics grade English grade 70 93 82 72 65 84 75 84 64 85 79 91 The correlation coefficient is r = (Round to three decimal places as needed.) Interpret the result. If there is a strong linear relationship, then the value of r will be close to Since the value of r in this case is to the desired value(s), there seem to be a strong linear relationship present. 1 or -1. 0. Compute and interpret the correlation coefficient for the following grades of 6 students selected at random. Mathematics grade 70 93 82 72 65 84 English grade 75 84 64 85 79 91 The correlation coefficient is r = ☐ (Round to three decimal places as needed.) Interpret the result. If there is a strong linear relationship, then the value of r will be close to Since the value of r in this case is to the desired value(s), there seem to be a strong linear relationship present. close not close

MATLAB: An Introduction with Applications
6th Edition
ISBN:9781119256830
Author:Amos Gilat
Publisher:Amos Gilat
Chapter1: Starting With Matlab
Section: Chapter Questions
Problem 1P
Question
Solve the following attached question. Please round to three decimal places for the
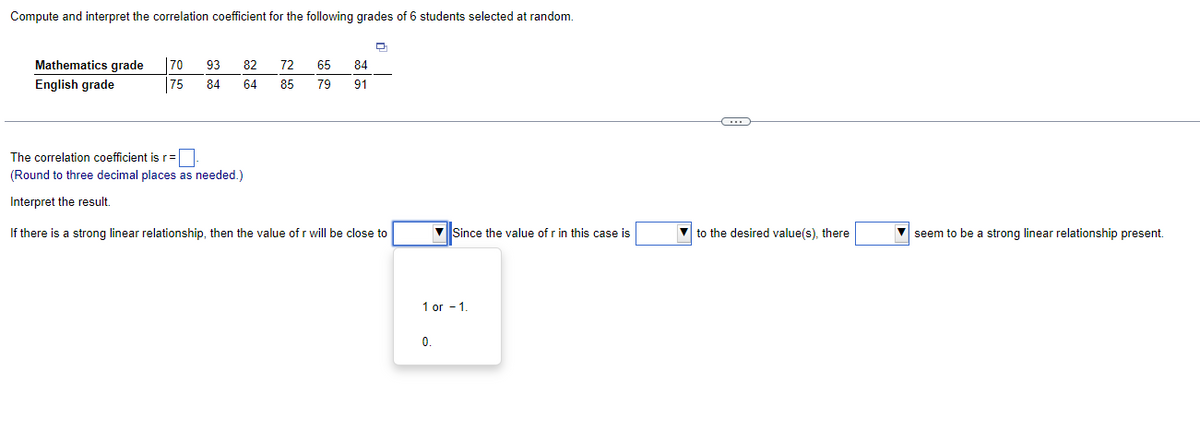
Transcribed Image Text:Compute and interpret the correlation coefficient for the following grades of 6 students selected at random.
Mathematics grade
English grade
70
93
82
72
65
84
75
84
64
85
79
91
The correlation coefficient is r =
(Round to three decimal places as needed.)
Interpret the result.
If there is a strong linear relationship, then the value of r will be close to
Since the value of r in this case is
to the desired value(s), there
seem to be a strong linear relationship present.
1 or -1.
0.
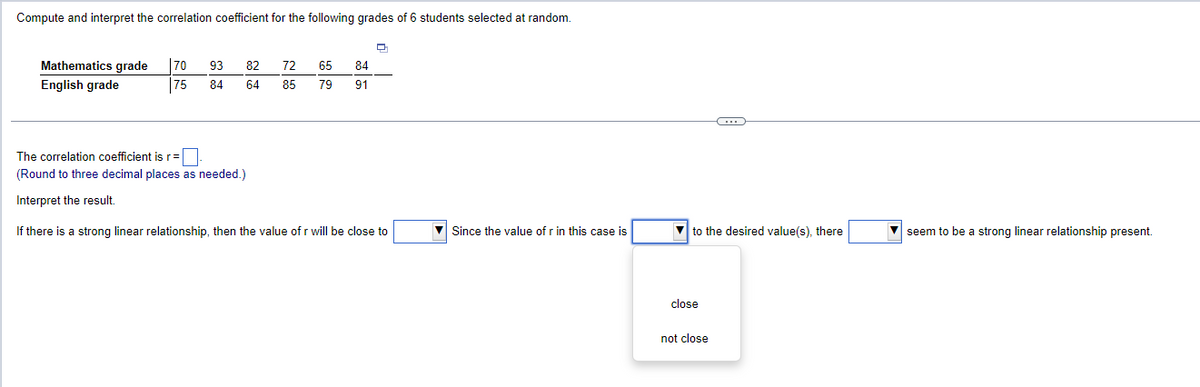
Transcribed Image Text:Compute and interpret the correlation coefficient for the following grades of 6 students selected at random.
Mathematics grade 70
93
82
72
65
84
English grade
75
84
64
85
79
91
The correlation coefficient is r = ☐
(Round to three decimal places as needed.)
Interpret the result.
If there is a strong linear relationship, then the value of r will be close to
Since the value of r in this case is
to the desired value(s), there
seem to be a strong linear relationship present.
close
not close
Expert Solution
This question has been solved!
Explore an expertly crafted, step-by-step solution for a thorough understanding of key concepts.

Step by step
Solved in 2 steps with 1 images

Recommended textbooks for you
MATLAB: An Introduction with Applications
Statistics
ISBN:
9781119256830
Author:
Amos Gilat
Publisher:
John Wiley & Sons Inc

Probability and Statistics for Engineering and th…
Statistics
ISBN:
9781305251809
Author:
Jay L. Devore
Publisher:
Cengage Learning

Statistics for The Behavioral Sciences (MindTap C…
Statistics
ISBN:
9781305504912
Author:
Frederick J Gravetter, Larry B. Wallnau
Publisher:
Cengage Learning
MATLAB: An Introduction with Applications
Statistics
ISBN:
9781119256830
Author:
Amos Gilat
Publisher:
John Wiley & Sons Inc
Probability and Statistics for Engineering and th…
Statistics
ISBN:
9781305251809
Author:
Jay L. Devore
Publisher:
Cengage Learning
Statistics for The Behavioral Sciences (MindTap C…
Statistics
ISBN:
9781305504912
Author:
Frederick J Gravetter, Larry B. Wallnau
Publisher:
Cengage Learning

Elementary Statistics: Picturing the World (7th E…
Statistics
ISBN:
9780134683416
Author:
Ron Larson, Betsy Farber
Publisher:
PEARSON

The Basic Practice of Statistics
Statistics
ISBN:
9781319042578
Author:
David S. Moore, William I. Notz, Michael A. Fligner
Publisher:
W. H. Freeman

Introduction to the Practice of Statistics
Statistics
ISBN:
9781319013387
Author:
David S. Moore, George P. McCabe, Bruce A. Craig
Publisher:
W. H. Freeman