COMPUTE FOR THE LIQUIDITY, SOLVENCY, EFFICIENCY AND PROFITABILITY USING THE DIFFERENT FORMULAS IN EACH CATEGORY.
COMPUTE FOR THE LIQUIDITY, SOLVENCY, EFFICIENCY AND PROFITABILITY USING THE DIFFERENT FORMULAS IN EACH CATEGORY.

Financial Accounting: The Impact on Decision Makers
10th Edition
ISBN:9781305654174
Author:Gary A. Porter, Curtis L. Norton
Publisher:Gary A. Porter, Curtis L. Norton
Chapter13: Financial Statement Analysis
Section: Chapter Questions
Problem 13.10E

Related questions

Question
COMPUTE FOR THE LIQUIDITY, SOLVENCY, EFFICIENCY AND PROFITABILITY USING THE DIFFERENT FORMULAS IN EACH CATEGORY.
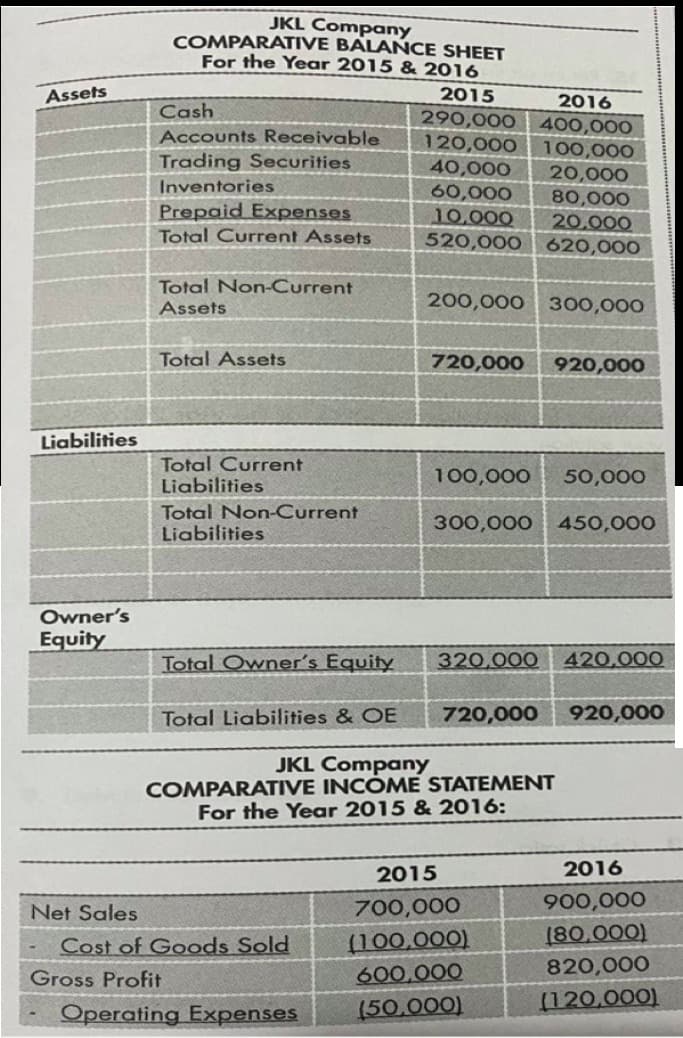
Transcribed Image Text:JKL Company
COMPARATIVE BALAŃCE SHEET
For the Year 2015 & 2016
Assets
2015
2016
Cash
290,000 400,000
120,000
Accounts Receivable
100,000
20,000
80,000
20,000
620,000
Trading Securities
40,000
60,000
10,000
Inventories
Prepaid Expenses
Total Current Assets
520,000
Total Non-Current
Assets
200,000
300,000
Total Assets
720,000
920,000
Liabilities
Total Current
Liabilities
100,000
50,000
Total Non-Current
Liabilities
300,000
450,000
Owner's
Equity
Total Owner's Equity
320,000
420,000
Total Liabilities & OE
720,000
920,000
JKL Company
COMPARATIVE INCÓME STATEMENT
For the Year 2015 & 2016:
2015
2016
Net Sales
700,000
900,000
Cost of Goods Sold
(100,000)
(80,000)
600.000
820,000
Gross Profit
Operating Expenses
(50,000)
(120,000)
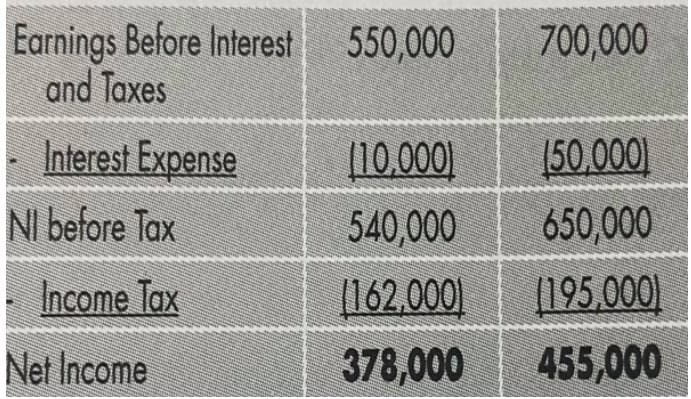
Transcribed Image Text:Earnings Before Interest
and Taxes
550,000
700,000
Interest Expense
(10.000)
(50,000)
NI before Tax
540,000
650,000
Income Tax
[162,000)
(195.000
Net Income
378,000
455,000
Expert Solution
This question has been solved!
Explore an expertly crafted, step-by-step solution for a thorough understanding of key concepts.

Step by step
Solved in 4 steps with 8 images

Knowledge Booster


Learn more about
Need a deep-dive on the concept behind this application? Look no further. Learn more about this topic, accounting and related others by exploring similar questions and additional content below.Recommended textbooks for you
Financial Accounting: The Impact on Decision Make…
Accounting
ISBN:
9781305654174
Author:
Gary A. Porter, Curtis L. Norton
Publisher:
Cengage Learning

Financial & Managerial Accounting
Accounting
ISBN:
9781285866307
Author:
Carl Warren, James M. Reeve, Jonathan Duchac
Publisher:
Cengage Learning
Financial Accounting: The Impact on Decision Make…
Accounting
ISBN:
9781305654174
Author:
Gary A. Porter, Curtis L. Norton
Publisher:
Cengage Learning
Financial & Managerial Accounting
Accounting
ISBN:
9781285866307
Author:
Carl Warren, James M. Reeve, Jonathan Duchac
Publisher:
Cengage Learning