PROFITABILITY RATIOS
Q: What are important profitability ratios?
A: Ratio analysis: The analysis of a company using the financial ratios and comparing its trends and…
Q: What is the Importance of the Profit Ratio?
A: Profit ratio: Profit ratio is utilized to assess the corporation's capacity to make revenue as…
Q: Explain profit margin
A: Profit margin is one of the benefits proportions that's generally utilized to assess the level to…
Q: why it is important to use profitability ratios
A: Ratio analysis is an evaluation tool used by the businesses with a view to obtain knowledge about…
Q: Profitability
A: Profitability is the prime purpose of every business. Every corporation tries to maximize its…
Q: What are the three main profitability ratios, and howis each calculated?
A: Ratio analysis is the method of checking the company's operational efficiency, liquidity, and…
Q: List the most important assumptions of cost-volume-profit analysis.
A: Cost Volume Profit Analysis (CVP Analysis): This analysis is helpful in determining that how any…
Q: Analyze the profitability graph that illustrates the factors/accounts that are needed to calculate…
A: The profitability graph: The profitability graph depicts all the inputs that are needed to compute…
Q: decision maker. What amount should Taylor report as segment profit?
A: Answer - P406,000 should be reported as segment profit for Taylor.
Q: Briefly explain the concept of economic, profitmaximizing pricing. It may be helpful to use graphs…
A: Pricing decisions: Pricing decisions is one of the most important and required decision for the…
Q: What is the possible link between the following ratios: (a) profitability and efficiency (b)…
A: SOLUTION A- Relation between profitability and efficiency ratios Profitability ratio depicts how…
Q: Match the ratio to the building block of financial statement analysis to which it best relates.A.…
A: Definition: Assets: These are the resources owned and controlled by business and used to produce…
Q: Discuss each group of ratio’s relationship to the balance sheet and income statement. Liquidity…
A: Ratio Analysis is a quantitative tool or method used for gaining insights into a company's…
Q: Discuss cost-benefit analysis and financial analysis tools
A: Answer: Cost-benefit analysis: It is nothing but a process of decision making that balances the…
Q: Describe the approaches of target profit.
A: Target Profit: It refers to the desired amount of profit that a company expects to achieve by the…
Q: ancial health of the given data b
A: Ratio Analysis - The ratio is the technique used by the prospective investor or an individual or…
Q: Trend analysis of net profit margin and leverage ratios help in identtyi
A: There are various types of risk a businessman needs to evaluate before starting up the business. The…
Q: Explain profitability index
A: Profitability index is a financial tool which tells us whether an investment should be accepted or…
Q: rite a short note on "Profitability Ratios"
A: Profitability ratio shows the ability and efficiency of the firm and show how much are the expenses…
Q: Compute the following ratio analysis: Operating Profit Margin Net Profit Margin Write your…
A: Current Year: Net Sales = 120,000 Operating Income = 43,000 Net Income = 35,000 Prior Year: Net…
Q: Explain profitability ratios
A: SOLUTION:- A profitability ratio is a measure of profitability, which is a way to measure a…
Q: The effects of financial choices can be understood by performing which of these? Check two. O Micro…
A: Decision making is the most important function of management. But when it comes to financial…
Q: Define the term Profit margins?
A: Financial Ratios: Financial ratios are the metrics used to evaluate the liquidity, capabilities,…
Q: Find the coverage ratio and profitability ratio
A: Ratio analysis is used for measuring the financial efficiency, profitability and revenue of an…
Q: Trend analysis of net profit margin and leverage ratios help in identifying
A: This ratio is used to measure the operational efficiency of the management. It shows whether the…
Q: Use the attached information to complete the ratio analysis. The Ratio Analysis is for…
A: Ratio analysis is useful to measure the financial performance of the company and helpful to make…
Q: Define “Market Value Added (MVA)” and “Economic Value Added(EVA).”
A: Introduction: Economic value added (EVA) and Market value added (MVA) are computations utilized to…
Q: profit margin ratio
A: Profit margin ratio = Net income * 100/Net sales
Q: Use the attached information to complete the ratio analysis. The Ratio Analysis is for Liquidity,…
A: Ratio analysis is a quantitative method of gaining insight into a company's liquidity, operational…
Q: Perform a profitability analysis
A: Profit is very important element of the business. Every business wants to have maximum profit in its…
Q: Define the terms market value added (MVA) and economic value added (EVA).
A: The concept of economic value added was developed by Stern Stewart & co & is also known as…
Q: Describe the use of profitability index.
A: Capital investment analysis: Capital investment analysis is the process by which management…
Q: Build an influence diagram that illustrates how to calculate profit.
A: Profit : Every business motive is to earn profit. Profit is generally earned when the business…
Q: Match the ratio to the building block of financial statement analysis to which it best relates.A.…
A: Debt to Equity ratio is calculated by the following formula: Debt to Equity = Debt/Equity
Q: structured
A: Structured products are well before assets that often incorporate equity assets as well as one or…
Q: Compute NET Profit margin ratio
A: Net profit margin ratio = Net Income/ Revenue * 100
Q: Compute the gross margin ratio and explain its use to assess profitability.
A: Gross margin ratio is the measure of profitability of the business and it depicts a ratio between…
Q: Match the ratio to the building block of financial statement analysis to which it best relates.A.…
A: Liquidity: Liquidity is what and how quickly company can turn assets into cash. Efficiency:…
Q: Identify and calculate the common ratios used to assess profitability.
A: Profitability ratios: Profitability ratios are those ratios that helps a company to access the…
Q: Describe the common profitability measures.
A: Common profitability measures include profitability ratios such as ROE, ROA, profit margin etc They…
EXPLAIN THE IMAGE PROVIDED GIVE RECOMMENDATION
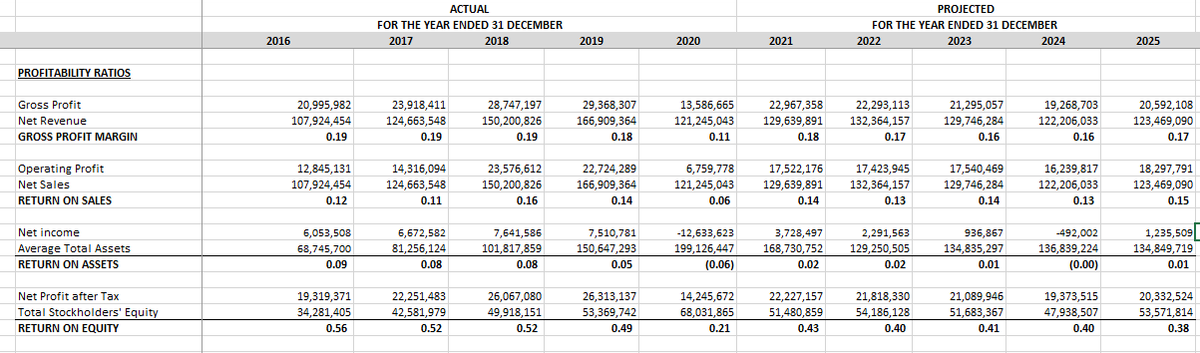
Step by step
Solved in 2 steps
- Description FY10 FY11 FY12 FY13 FY14 Financial Statements GBP m GBP m GBP m GBP m GBP m Income Statements Revenue 4,390 3,624 3,717 8,167 11,366 Profit before interest & taxes (EBIT) 844 700 704 933 1,579 Net Interest Payable (80) (54) (98) (163) (188) Taxation (186) (195) (208) (349) (579) Miniorities (94) (99) (105) (125) (167) Profit for the year 484 352 293 296 645 Balance Sheet Fixed Assets 3,510 3,667 4,758 10,431 11,483…Randall Corporation reported the following revenue data:Year Net revenues (in millions)$$$$6,8007,0046,7327,2762016201720182019Use 2016 as the base year. The trend percentage in 2019 is closest toa. 93%.b. 104%.c. 107%.d. 112%tion 8Income statement for the year ended 31 December, 2019 of KKMTN Ghana Ltd2018 2019ȼ ‘000 ȼ ‘000Turnover 420,000 523,600Cost of sales (330,000) (417,200)Gross profit 89,000 106,400Expenses:Administration 44,600 50,200Selling and distribution 15,400 (60,000) 19,600 (69,800)Profit before interest 29,000 36,600Debenture interest - (2,800)Net profit before tax 29,000 33,800Taxation (8,000) (10,000)Net Profit after tax 21,000 23,800Ordinary dividend paid 8,400 9,250Ordinary shares issued 12 million and trading at ȼ3 each as at yesterday onGSE.You are required to compute the following investment ratios:a). Earnings per shareb). Dividend per sharec). Payout ratiod). Price earnings ratioe). Earnings yield
- Year 2010 2011 2012 2013 2014 2015 2016 2017 2018 2019 Net Profit ($ 000’) <blank> 50 200 150 225 250 <blank> 200 250 260 Relative Percentage Change N/A -50% 300% <blank> 50% 11% -30% 14% 25% <blank> Table 1: Net Profit ($) per financial yearReturn on total assets ratio: net income/ average total assets 21,331/(321,195+225,248)/2= 0.07807= 7.8% (2020 year) 11588/(162,648+225,248)/2= 0.059= 6.0% (2019 year) Write financial analysis report.17. Halal Berhad’s comparative financial statements for the years ending 31 December 2020, and 2019, are as follows. Halal Berhad’s common stock market price was RM35 on 31 December 2020 and RM40 on 31 December 2019. Halal Berhad Statement of Profit or Loss and Other Comprehensive Income For the years ended 31 December 2020 and 2019 2020 (RM’000) 2019 (RM’000) Sales 1,200 1,000 Cost of goods sold 500 475 Gross Profit 700 525 Selling expenses 240 200 Administrative expenses 180 150 Total operating expenses 420 350 Income from operations 280 175 Other income 166 225 446 400 Other expense (interest) 66 60 Income before income tax 380 340 Income tax expense 80 60 Net income 300 280 Halal Berhad Statement of Financial Position As at 31 December 2020…
- How do you calculate the TTM? Particulars 2007 2008 2009 2010 2011 2012 2013 2014 2015 2016 2017 2018 TTM Sales ₱ 32,067.00 ₱ 35,422.00 ₱ 70,881.00 ₱ 95,519.00 ₱ 122,128.00 ₱ 165,654.00 ₱ 188,793.00 ₱ 232,834.00 ₱ 263,159.00 ₱ 273,046.00 ₱ 269,693.00 ₱ 294,619.0047. Halal Berhad’s comparative financial statements for the years ending 31 December 2020, and 2019, are as follows. Halal Berhad’s common stock market price was RM35 on 31 December 2020 and RM40 on 31 December 2019. Halal Berhad Statement of Profit or Loss and Other Comprehensive Income For the years ended 31 December 2020 and 2019 2020 (RM’000) 2019 (RM’000) Sales 1,200 1,000 Cost of goods sold 500 475 Gross Profit 700 525 Selling expenses 240 200 Administrative expenses 180 150 Total operating expenses 420 350 Income from operations 280 175 Other income 166 225 446 400 Other expense (interest) 66 60 Income before income tax 380 340 Income tax expense 80 60 Net income 300 280 Halal Berhad Statement of Financial Position As at 31…E23.10B (L0 1,4) (Classification of Transactions) Following are selected balance sheet accounts of BioLazer Corp. at December 31, 2020 and 2019, and the increases or decreases in each account from 2019 to 2020. Also presented is selected income statement information for the year ended December 31, 2020, and additional information. Increase Selected balance sheet accounts 2020 2019 (Decrease)AssetsAccounts receivable $154,000 $120,000 $34,000Property, plant, and equipment 631,000 581,000 50,000Accumulated…
- Problem 13-2A (Static) Ratios, common-size statements, and trend percents LO P1, P2, P3 Skip to question [The following information applies to the questions displayed below.]Selected comparative financial statements of Korbin Company follow. KORBIN COMPANY Comparative Income Statements For Years Ended December 31 2021 2020 2019 Sales $ 555,000 $ 340,000 $ 278,000 Cost of goods sold 283,500 212,500 153,900 Gross profit 271,500 127,500 124,100 Selling expenses 102,900 46,920 50,800 Administrative expenses 50,668 29,920 22,800 Total expenses 153,568 76,840 73,600 Income before taxes 117,932 50,660 50,500 Income tax expense 40,800 10,370 15,670 Net income $ 77,132 $ 40,290 $ 34,830 KORBIN COMPANY Comparative Balance Sheets December 31 2021 2020 2019 Assets Current assets $ 52,390 $ 37,924 $ 51,748 Long-term investments 0 500 3,950 Plant assets, net 100,000 96,000 60,000 Total assets $ 152,390 $ 134,424 $ 115,698 Liabilities…ccounting Assume the following sales data for a company: 2026 $734000 2025 655500 2024 570000 If 2024 is the base year, what is the percentage increase in sales from 2024 to 2025? 129% 29% 115% 15%QWC 2016 $000 2017 $000 2018 $000 2019 $000 2020 $000 2021 $000 Current ratio 0.66 0.58 0.96 0.92 1.06 0.83 Quick ratio 0.43 0.37 0.58 0.53 0.49 0.57 Operating cash flow ratio 0.10 0.01 0.01 0.00 0.02 0.07 MMC Current ratio 2.37 2.23 2.07 1.89 2.74 2.16 Quick ratio 0.93 0.95 0.81 0.80 1.36 1.01 Operating cash flow ratio 1.02 0.72 0.96 0.47 0.32 0.52 Please interpret the ratio for both the companies. Not required to explain the theory just interpret the values for the following: 1) Current Ratio 2) Quick Ratio 3) Operating cash flow ratio