Compute the coefficient of variation of each data. Which of the two twine types is more uniform in strength? 350 361 363 364 365 366 371 377 377 377 379 380 380 392 350 354 359 363 365 368 369 371 373 374 376 380 383 388 392
Compute the coefficient of variation of each data. Which of the two twine types is more uniform in strength? 350 361 363 364 365 366 371 377 377 377 379 380 380 392 350 354 359 363 365 368 369 371 373 374 376 380 383 388 392

Glencoe Algebra 1, Student Edition, 9780079039897, 0079039898, 2018
18th Edition
ISBN:9780079039897
Author:Carter
Publisher:Carter
Chapter10: Statistics
Section10.5: Comparing Sets Of Data
Problem 14PPS

Related questions
Question
100%
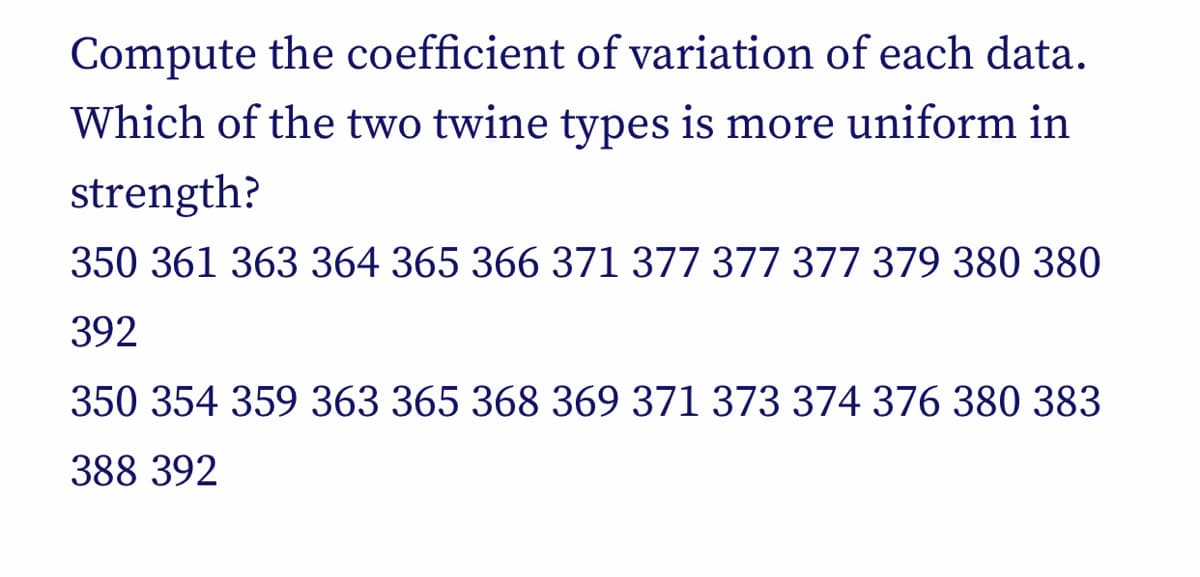
Transcribed Image Text:Compute the coefficient of variation of each data.
Which of the two twine types is more uniform in
strength?
350 361 363 364 365 366 371 377 377 377 379 380 380
392
350 354 359 363 365 368 369 371 373 374 376 380 383
388 392
Expert Solution
This question has been solved!
Explore an expertly crafted, step-by-step solution for a thorough understanding of key concepts.

Step by step
Solved in 2 steps with 10 images

Recommended textbooks for you
Glencoe Algebra 1, Student Edition, 9780079039897…
Algebra
ISBN:
9780079039897
Author:
Carter
Publisher:
McGraw Hill
Glencoe Algebra 1, Student Edition, 9780079039897…
Algebra
ISBN:
9780079039897
Author:
Carter
Publisher:
McGraw Hill