2. Given the following frequency distribution. Class Interval f 245 - 264 225 - 244 4 11 205 – 224 25 185 – 204 33 165 - 184 20 145- 164 7 Find the a. range b. mean deviation c. variance (use any two of the three formulas) d. standard deviation.
2. Given the following frequency distribution. Class Interval f 245 - 264 225 - 244 4 11 205 – 224 25 185 – 204 33 165 - 184 20 145- 164 7 Find the a. range b. mean deviation c. variance (use any two of the three formulas) d. standard deviation.

Glencoe Algebra 1, Student Edition, 9780079039897, 0079039898, 2018
18th Edition
ISBN:9780079039897
Author:Carter
Publisher:Carter
Chapter10: Statistics
Section10.5: Comparing Sets Of Data
Problem 14PPS

Related questions
Question
Please help answer thank you
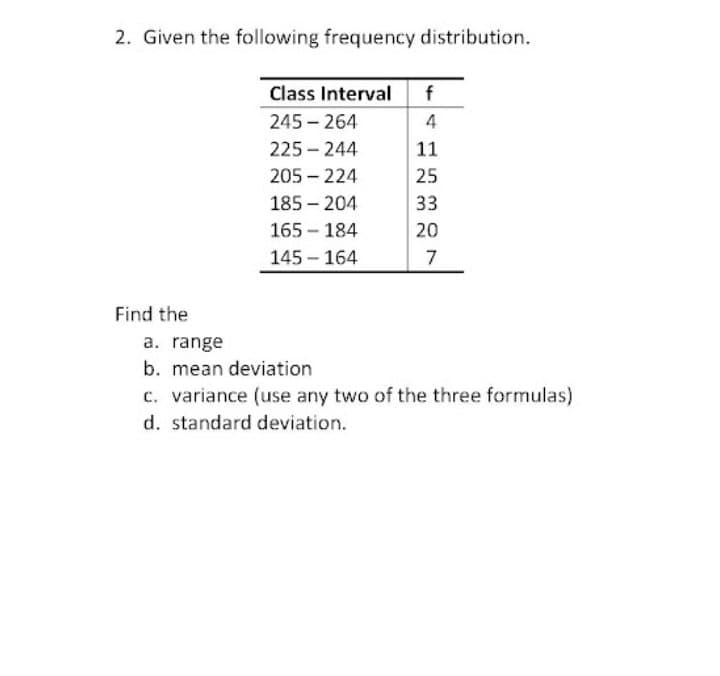
Transcribed Image Text:2. Given the following frequency distribution.
Class Interval
f
245- 264
4
225 – 244
11
205 - 224
25
185 – 204
33
165 184
145 - 164
20
-
7
Find the
a. range
b. mean deviation
c. variance (use any two of the three formulas)
d. standard deviation.
Expert Solution
This question has been solved!
Explore an expertly crafted, step-by-step solution for a thorough understanding of key concepts.

Step by step
Solved in 2 steps with 2 images

Recommended textbooks for you
Glencoe Algebra 1, Student Edition, 9780079039897…
Algebra
ISBN:
9780079039897
Author:
Carter
Publisher:
McGraw Hill
Glencoe Algebra 1, Student Edition, 9780079039897…
Algebra
ISBN:
9780079039897
Author:
Carter
Publisher:
McGraw Hill