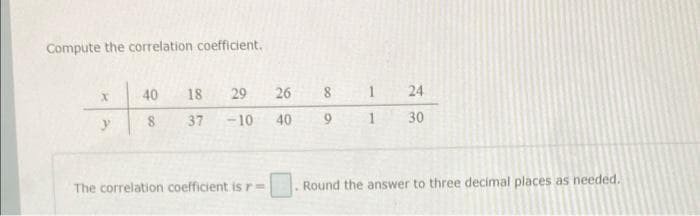
Compute the correlation coefficient. | X y 40 8 18 29 37 -10 The correlation coefficient is r= 26 8 40 9 1 24 1 30 Round the answer to three decimal places as needed.


Q: Suppose that the world's current oil reserves is R = 2140 billion barrels. If, on average, the total…
A: A) The current oil reserves is R = 2140.
Q: Let S denote the sample variance for a random sample of ten In(LC50) values for copper and let S…
A:
Q: In a survey, 10 people were asked how much they spent on their child's last birthday gift. The…
A:
Q: The probability that a student correctly answers on the first try (the event A) is P(A) = 0.2. If…
A: Let A= the student correctly answers on the first try B=the student correctly answers on the second…
Q: and operate Medical researchers have developed a new artificial heart constructed primarily of…
A:
Q: A television show conducted an experiment to study what happens when buttered toast is dropped on…
A: The question is about hypo. testing Given : Total no. of buttered slices ( n ) = 42 No. of slices…
Q: 8. 9. 10. 11. 12. 13. What is the approximate center (median) tip percent for Jill? 14. What is the…
A: Since you have asked multiple questions, we will solve the first question for you. If you want any…
Q: Twenty percent of the employees in a company are college graduates. Of these 75% are in supervisory…
A: Given that: Probability that a person is college graduate is, P(G)=0.20 Probability that a college…
Q: What is the confidence interval estimate of the population mean µμ? °F <H<°F (Round to three decimal…
A: It is given that Sample size n = 106 Sample mean M = 98.9 Sample SD s = 0.63 Confidence level = 99%
Q: The following stem-and-leaf plot is constructed using data collected from the speed (km/h) of cars…
A: The stem and leaf plot is given for the data set. The key is given by, 50|9 = 50.9 Similarly the key…
Q: A test to determine whether a certain antibody is present is 99.6% effective. This means that the…
A: Given that When antibody is not present Probability that test is negative=0.996 Probability that…
Q: 3. Suppose that Y₁, Y₂... Ym and X₁, X2, Xm are independent normally distributed random samples from…
A:
Q: Whenever we convert scores from their original units of measurement (e.g., minutes, MPH, ounces)…
A: The z score is defined as Z = (X - mean)/SD
Q: The test statistic of z= -1.77 is obtained when testing the claim that p *0.619. This is a…
A: Given Test statistic Z=-1.77, Hypothesis Ho: p=0.619 vs H1: p≠0.619 (claim) two tailed Level of…
Q: (3) Look at the boxplot below, which shows data for the selling price of homes in a certain…
A: Given that Using the given Box Plot we have to find a.. What was the typical selling price? b.…
Q: The year-end dividend yields (%) for a sample of 48 top-performing stocks are shown in the table…
A: we arrange data in accending order, 2.5 , 2.5 , 2.6 , 2.7 , 2.9 , 3 , 3 , 3.1 , 3.2 , 3.3 , 3.4 ,…
Q: You may need to use the appropriate appendix table or technology to answer this question. The makers…
A: Data given n=52, sample mean x̄=24, s=sample standard deviations=5
Q: There are 4 resistors, 3 inductors and 6 capacitors in a box. If a component is selected at random,…
A: Given that Total = 4 + 3 + 6 = 13 Resistor = 4 , Inductor = 3 , Capacitors =6
Q: of z that comes closest to satisfying each case, sketch a standard Normal curve with your value of z…
A: Standard normal distribution. We know that Half area under the curve = 0.50 Total area under the…
Q: Over the years, the mean IQ of freshmen applicants in a university in a province has been determined…
A: Given: Sample size, n=85 Sample mean, x¯=94 Sample sd, s=10 Population mean to claimed, μ=91
Q: Table 2. Mortality by Selected Age Groups, Males and Females, Sinclair City, 2009 Males Total…
A: Hint: Use following formulas to calculate Maternal Mortality Ratio (MMR), Infant Mortality Rate…
Q: K In a survey of a group of men, the heights in the 20-29 age group were normally distributed, with…
A: Given that, in a survey of a group of men, the heights were normally distributed with mean 68.6…
Q: g. What percent of students scored no more than 30? 0 =% h. Is it possible to determine individual…
A: given graph can be converted to table as class frequency 10-15 1 15-20 3 20-25 0 25-30 24…
Q: Let p denote the population proportion of all Americans who prefer to watch the news rather than…
A:
Q: A paired difference experiment is conducted to compare the starting salaries of male and female…
A: The t test are type of parametric test. It follows the assumption of normal distribution in the…
Q: Suppose that a random sample X₁, X₂,...,X20 follows an exponential distribution with parameter ß.…
A:
Q: 6. Suppose that a random sample X is given by a probability density function f(x)=(-2), 0<x<B - -…
A:
Q: A truth serum has the property that 93% of the guilty suspects are properly judged while, of course,…
A: Given that We have to find the probability that the suspect is innocent is
Q: Two events E and F are ________ if the occurrence of event E in a probability experiment does not…
A: Given that If the occurrence of event E in a probability experiment does not affect the probability…
Q: Use the given information to find the minimum sample size required to estimate an unknown population…
A: GivenMargin of error(E)=5standard deviation(σ)=60confidence level=95%
Q: You and nine of your classmates are attending an event. How many ways can you be arranged in a…
A: You and nine of your classmates are attending an event.so total number of classmates =10
Q: It is known from the records of the city schools that the standard deviation of mathematics test…
A: standard deviation of mathematics test scores on problem solving is 5. A sample of 200 bright…
Q: Instruction: Round your answer to 1 decimal place. Flow rate of callers 40.0 per minute
A: flow rate is given by : flow rate = total no. of callers / time taken time taken = 20 minute total…
Q: A random sample of 88 students belonging to a college was taken. It was observed that the mean…
A: From the provided information, Sample size (n) = 88 Sample mean (x̄) = 170.1 Population standard…
Q: b. What is the frequency of the 3.0 to <3.5 interval? 8 c. What proportion of the dividend yields…
A: GIVEN DATA dividend yield frequency 2.5 to < 3.0 5 3.0 to < 3.5 6 3.5 to < 4.0 11…
Q: You are a physician meeting with a patient who has just been diagnosed with cancer. You know there…
A: When probability of one event depends on another, we use conditional probability. It is the…
Q: The claim is that smokers have a mean cotinine level greater than the level of 2.84 ng/mL found for…
A:
Q: 7.15 Suppose that X₁, X₂, ..., X and Y₁, Y₂,..., Y,, are independent random samples, with the…
A: Given that E(Xi) =µ1 and V(Xi) = σ21 Given that E(Yi) =µ2 and V(Yi) = σ22
Q: HOMEWORK: #1 Given the distribution: CLASS 30-40 41-51 52-62 63-73 TOTAL Find the: F 15 4 12 13 44…
A: Class f x f*x cf 30-40 15 35 525 15 41-51 04 46 184 19 52-62 12 57 684 31 63-73 13 68 884 44…
Q: The current student population of New York City is 2300. If the population increase at a rate of 19%…
A: given data initial current population (a) = 2300 population increase rate : 19% each year (∴ growth…
Q: Find the quartiles of the following set of numbers: 0.5, 1, 3.5, 7.2,-5, 8.3, 4. (a) Q₁ = (b) Q₂:…
A: here we have to find out the quartiles of the following set of numbers:here we have to find out the…
Q: At Center Hospital there is some concern about the high turnover of nurses. A survey was done to…
A:
Q: The claim is that weights (grams) of quarters made after 1964 have a mean equal to 5.670 g as…
A: given data claim: μ=5.670n=39 ∴df=n-1=38t=-2.866Pvalue=?α=0.01 , conclusion
Q: Which term of the arithmetic sequence 1, 9, 17, 25, It is the th term. Calculator ... is 297?
A: Given that First term = a1 = 1 , Second term = a2 = 9 nth term = an = 297
Q: Suppose a boxplot has the following five-number summary: min=21, Q1 = 47, Q2-53, Q3 = 329, max=415…
A:
Q: Consider the following table: 1 2 3 5 7 8 R₁ 0.2995 0.7599 0.6189 0.3578 0.6948 0.4765 0.8897 0.0991…
A: μ =Service rate = 2 ρ = λμ0.95=λ2λ=1.9 The capacity of the system n = 10
Q: 1.2Differentiate between a factor and a response variable.
A: Given the Differentiate between a factor and a response variable.
Q: 3. An nursing student was curious to determine what sample size would be required to be 99% sure…
A:
Q: In testing a certain kind of missile, target accuracy is measured by the average distance X (from…
A: given data, here The distance X is measured in miles and the sampling distribution of X is given by…
Q: P(0 ≤ z≤ 0.64) b. P(-1.46 ≤z≤ 0) C. P(Z > 0.44)
A: As per our company guidelines we are supposed to answer only first 3 sub-parts. Kindly repost other…

Step by step
Solved in 2 steps

- 1. Find the correlation coefficient for the measurementsFind the linear correlation coefficient, r, then determine whether there is sufficient evidence to support the claim of a linear correlation between the two variables. The linear correlation coefficient is r= _____ (Round to three decimal places as needed.)A researcher computes the correlation coefficient r =r= 0.6939 for an explanatory and response variable. What proportion of the changes in the response variables value is accounted for by the change in the explanatory variable's value? Give your answer to four decimal places.
- The Pearson's r correlation between two variables X and Y is calculated to be 0.6. What can be concluded from this correlation coefficient about the relationship between X and Y?If the correlation coefficient r is equal to 0.321 , find the coefficient of determinationBut the problem has provided us with the Spearman rank correlation of 0.679. Shouldn't I use that as my r value to calculate 95% CI?
- Calculate the correlation coefficient, r. Show your complete, step-by-step solution. Round your final answer totwo decimal places.3. Find the linear correlation coefficient , r. Round to four decimal places .b. Find the linear correlation coefficient, r, then determine whether there is sufficient evidence to support the claim of a linear correlation between the two variables.
- Make up a table with five pieces of bivariate data and determine the correlation coefficient, r. Then switch the values of the x’s and y’s and compute the correlation coefficient. Has the value of r changed.Find Rs using spearman rank correlation coefficientFor a correlation of -.64 between X and Y, each 1 _SD change in Zx corresponds to a predicted change of _____________SD in Zy.