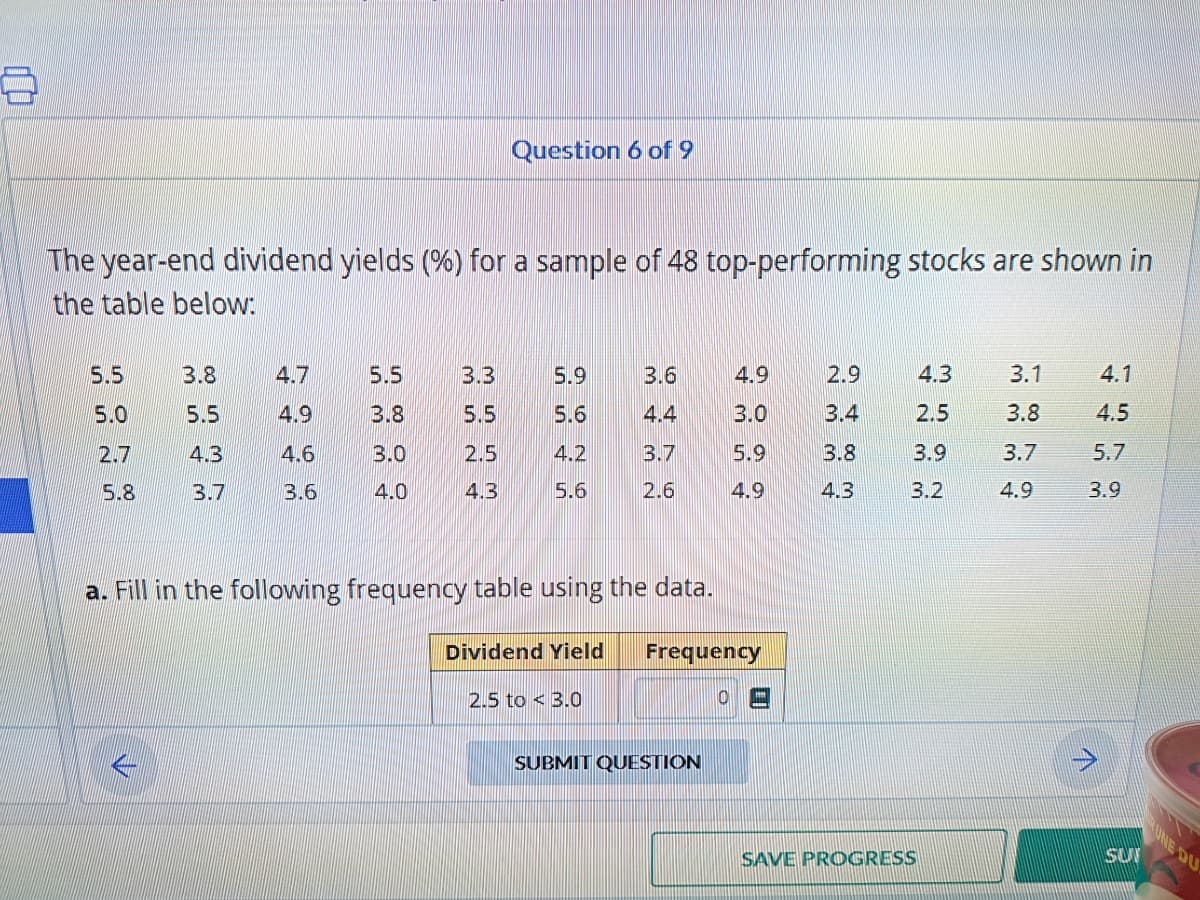
The year-end dividend yields (%) for a sample of 48 top-performing stocks are shown in the table below: 5.5 5.0 2.7 5.8 3.8 5.5 4.3 3.7 4.7 4.9 4.6 3.6 5.5 3.8 3.0 4.0 3.3 5.5 2.5 4.3 5.9 5.6 4.2 5.6 3.6 4.4 3.7 2.6 2.5 to 3.0 a. Fill in the following frequency table using the data. Dividend Yield Frequency SUBMIT QUESTION 4.9 3.0 5.9 4.9 0 2.9 3.4 80 m 3.8 4.3 4.3 2.5 3.9 3.2 3.1 3.8 3.7 4.9 4.1 4.5 5.7 3.9
The year-end dividend yields (%) for a sample of 48 top-performing stocks are shown in the table below: 5.5 5.0 2.7 5.8 3.8 5.5 4.3 3.7 4.7 4.9 4.6 3.6 5.5 3.8 3.0 4.0 3.3 5.5 2.5 4.3 5.9 5.6 4.2 5.6 3.6 4.4 3.7 2.6 2.5 to 3.0 a. Fill in the following frequency table using the data. Dividend Yield Frequency SUBMIT QUESTION 4.9 3.0 5.9 4.9 0 2.9 3.4 80 m 3.8 4.3 4.3 2.5 3.9 3.2 3.1 3.8 3.7 4.9 4.1 4.5 5.7 3.9

Holt Mcdougal Larson Pre-algebra: Student Edition 2012
1st Edition
ISBN:9780547587776
Author:HOLT MCDOUGAL
Publisher:HOLT MCDOUGAL
Chapter7: Percents
Section7.2: Percents And Proportions
Problem 18E

Related questions
Question
Transcribed Image Text:8
The year-end dividend yields (%) for a sample of 48 top-performing stocks are shown in
the table below:
5.5
5.0
2.7
5.8
3.8
5.5
4.3
3.7
4.7
4.9
4.6
3.6
5.5
3.8
3.0
4.0
Question 6 of 9
3.3
5.5
2.5
4.3
5.9
96
5.6
4.2
5.6
3.6
4.4
3.7
2.6
a. Fill in the following frequency table using the data.
Dividend Yield Frequency
2.5 to 3.0
SUBMIT QUESTION
4.9
3.0
5.9
4.9
0
2.9
3.4
3.8
4.3
4.3
2.5
3.9
3.2
SAVE PROGRESS
3.1
3.8
3.7
4.9
4.1
4.5
5.7
3.9
SUV
UNE DU
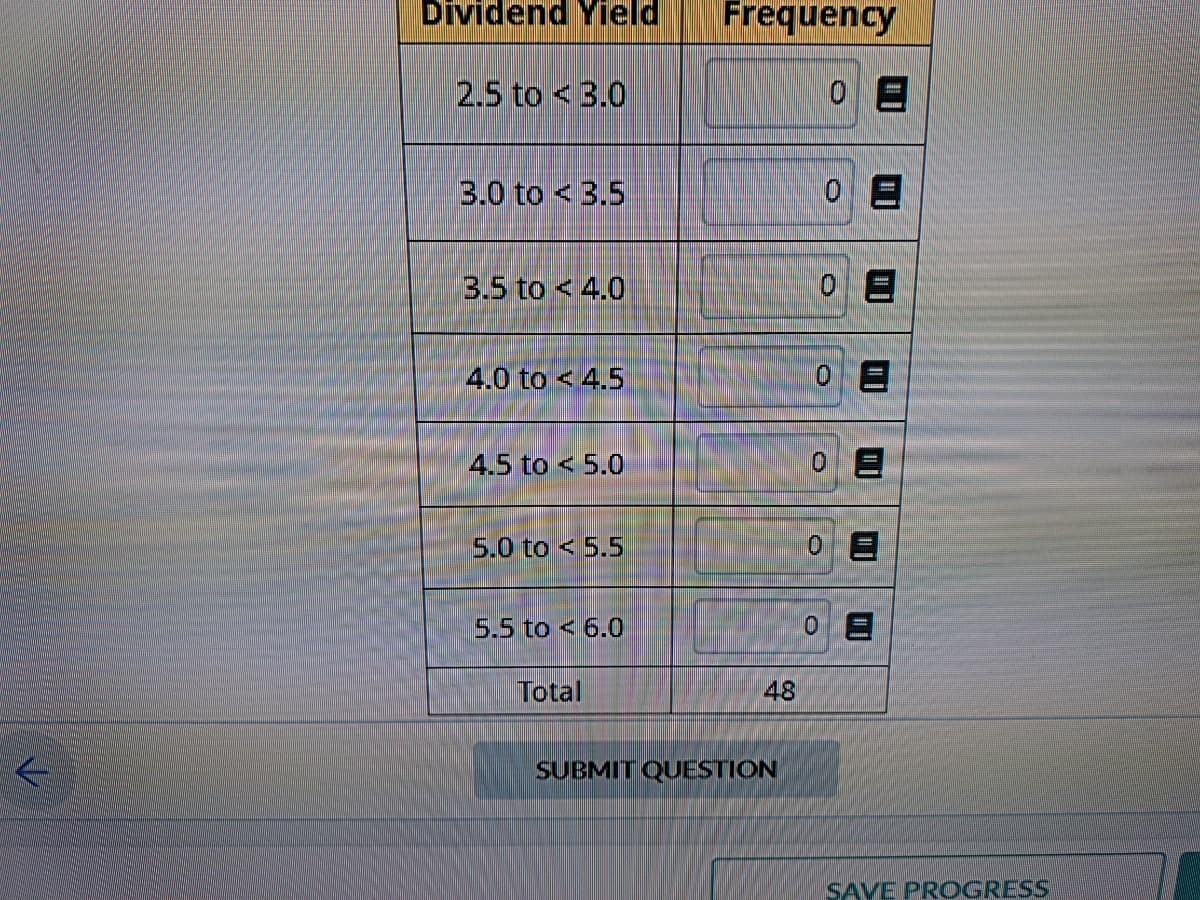
Transcribed Image Text:Dividend Yield
2.5 to 3.0
3.0 to 3.5
3.5 to 4.0
4.0 to 4.5
4.5 to 5.0
5.0 to 5.5
5.5 to 6.0
Total
Frequency
0 E
48
SUBMIT QUESTION
0
0 2
0
0
0
SAVE PROGRESS
Expert Solution
This question has been solved!
Explore an expertly crafted, step-by-step solution for a thorough understanding of key concepts.

Step by step
Solved in 2 steps

Recommended textbooks for you
Holt Mcdougal Larson Pre-algebra: Student Edition…
Algebra
ISBN:
9780547587776
Author:
HOLT MCDOUGAL
Publisher:
HOLT MCDOUGAL
Holt Mcdougal Larson Pre-algebra: Student Edition…
Algebra
ISBN:
9780547587776
Author:
HOLT MCDOUGAL
Publisher:
HOLT MCDOUGAL