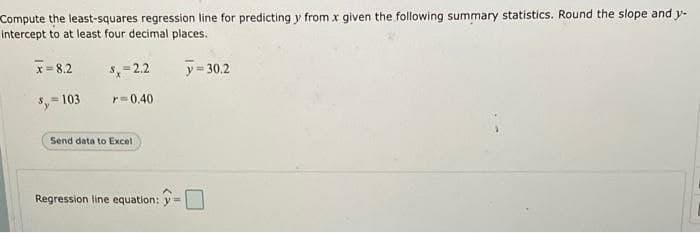
Compute the least-squares regression line for predicting y from x given the following summary statistics. Round the slope and y- intercept to at least four decimal places. x= 8.2 S- 2.2 y= 30.2 = 103 r=0.40 Send data to Excel Regression line equation: y =


Q: newsboy can sell an average of 45 newspapers a day. For the last 2 weeks (14days), he sold an…
A: Given data : sample size, n =14 sample mean, x̄ = 38 sample standard deviation,s= 14…
Q: 2. Accepting a false null hypothesis is a description of __________. a. Alternative Hypothesis b.…
A: As per our guidelines we can solve first multiple-choice question and rest can be reposted…
Q: EXPERIENCES HAD SHOWN THAT 20% OF A MANUFACTURED PRODUCT IS ON THE TOP QUALITY. IN DAY PRODUCTION OF…
A:
Q: A hypothesis test produces a p-value of 15%. Which of the following are DEFINITELY true? Check all…
A: Given that, A hypothesis test produces a p-value of 15%. That is, p=0.15
Q: A total of 240 students enrolled in one of two STAT 250 sections-one meeting during the day and one…
A:
Q: You are trying to estimate the percent of people in California who have a college degree. You…
A: According to the given information in this question We need to identify that from the given…
Q: An adventure company runs two obstacle courses, Fundash and Coolsprint. The designer of the courses…
A: There are two independent samples which are Fun dash runners and Cool sprint runners. We have to…
Q: Ali has recently started a new job on the sales team of a very competitive corporation. He closed…
A: Given that, Ali has recently started a new job on the sales team of a very competitive corporation.…
Q: The mean age of 31 slot mechanic player is 51.3 years, and the standard deviation is 6.8 years.the…
A:
Q: From a large consignment of clementine fruit destined for a UK supermarket the cus- toms office is…
A:
Q: An internet code consists of one digit followed by one letter, The number zero and letter O are…
A:
Q: 120 shoppers are intercepted in several shopping malls in Westchester county to complete a cell…
A: In the given problem we have given that, 120 shoppers are intercepted in several shopping malls in…
Q: ame ailment. The following data ney were completely cured. Wha reatment? (level of significance…
A: A B C D Patient 1 10 11 3 6 Patient 2 9 11 4 10 Patient 3 6 18 5 8 Patient 4 7 6 7 11…
Q: A 99% confidence interval for the percentage of people in a town who have a college degree is…
A: We have given that the 99% confidence interval for the percentage of people in a town who have a…
Q: A community-based intervention program for hypertension was undertaken in two communities to compare…
A: Solution: From the given information,
Q: During the first few weeks of the new television season, the evening news audience proportions were…
A: The answer is attached below,
Q: An number cube (a fair die) is rolled 3 times. For each roll, we are interested in whether the roll…
A: Given information: Outcome eeo eee eoo ooo oee eoe oeo ooe value of X 1 9 -3 -3 1 1 -3 -3…
Q: A random sample of records of home sales from March 1 to July 1, 2010 from the files maintained by…
A: The independent variable is size of the home and the dependent variable is price.
Q: Given the table below, use your calculator to find the Correlation Coefficient xx 7.1 9.6 8.9 4.5…
A: We have given that, X :- 7.1, 9.6, 8.9, 4.5, 2.9, 4.4 Y:- 17.9, 25, 22.4, 18.6, 12.3, 15.9 Then,…
Q: A 95% confidence interval for the average household income in a town is constructed based on a…
A: Given: The 95% confidence interval of population mean is [ 64000 , 86000]
Q: e data were collected from a specific statistics class. The first row gives the variable Eye Color…
A: Given The data were collected from a specific statistics class.
Q: A nationwide job recruiting firm wants to compare the annual incomes for childcare workers in…
A: There are two independent samples which are Illinois and Massachusetts. We have to test whether the…
Q: In general, the correct interpretation of a 95% confidence interval for the population mean is: O a.…
A:
Q: +, 10, 20 14, 17, 16, 21, 24, 22, 30, 35, 26 and 16 inches. Determine the median height.
A:
Q: Determine a function using x and y that models the relationship above. Part B What is the…
A: here use basic of regression line
Q: (a) State the null hypothesis H, and the alternative hypothesis H,. 1' Ho :0 H, :0 OP (b) Determine…
A: The provided information is n1=15, n2=7x¯1=182, x¯2=181s1=8, s2=6α=0.05a.The null and alternative…
Q: Find the area of the shaded region. The graph to the right depicts IQ scores of adults, and those…
A: Let X be the random variable from normal distribution with mean (μ) = 100 and standard deviation (σ)…
Q: According to Census data, in 1960 the population of the U.S amounted to 151.3 million persons, and…
A: The objective is to interpret the shifted population in the West from 1960 to 2000 in terms of…
Q: Important: This question continues from the previous three question and onto the following question.…
A: From the given information we conduct z test for Proportion.
Q: Graph the iıne. y= 3x-8 Ty 8- 6- 4 2- -8 -6 -2 2. -2- 4- -64 8 图 X
A:
Q: A MANUFACTURER CLAIMS THAT ONLY 4% OF HIS PRODUCTS ARE DEFECTIVE. A RANDOM SAMPLE OF 500 WAS TAKEN…
A: Given that the manufacturer claims that only 4% of his products are defective. Null Hypothesis:…
Q: (d) Consider the process X, = ,X-1 +€ + 01€-1 + 0ze-2 where . 0, and 0, are model parameters; and…
A:
Q: A large group of people get together. Each one rolls a die 150 times, and counts the number of aces…
A: Given : n = 150 p = 1/6
Q: True or false For a normally distributed random variable, P(X > µ) = .5
A:
Q: Does this indicate that his sales have gone lower?
A: here given , n = sample size = 14 sample mean = 38 sample standard deviation = 14
Q: Direction: Compute and Illustrate the distribution of the mean. The average price of a computer is…
A:
Q: An airline is trying two new boarding procedures, Option 1 and Option 2, to load passengers onto…
A: Solution: Given information: Option 1 sample statistic are n1= 265 x1 = 17.6 s1= 4.7Option 2 sample…
Q: A standard deck of cards contains 52 cards, with 13 cards of each suit. Four cards will be dealt off…
A: We have given the following statement about cards.
Q: 14. Suppose you build a Partial Least Squares model where you prepared the data by centering and…
A: No, we cannot proceed to perform a 5-fold Cross Validation without performing additional data…
Q: Scenario: Is there a relationship between amount of time at a job (X) and productivity (Y)? The…
A: Four types of measurement levels: Nominal level: It consists of only categories in which the data…
Q: Multiple Choice 0.4015 0.0985 0.9015 -1286
A: Given Mean =76 Standard deviation =7
Q: One of the theories behind the large polling errors in 2016 election was the "shy Trump voter".…
A: The answer is response bias.
Q: Construct a 90% confidence interval for the mean highway mileage for hybrid cars. A random sample of…
A:
Q: Son, Ron and Bob are patients in one ward of a hospital to be discharged respectively after each…
A: Son, Ron and Bob are patients in one ward of a hospital to be discharged respectively after each…
Q: Use the accompanying data set to complete the following actions. a. Find the quartiles. b. Find the…
A: From the provided information, The number of observations (n) = 15
Q: 3. Twe procewo A and 8, were ued to proaduce stainless steel shafts in an industrial company.…
A:
Q: In 1970, 590 students among 1000 randomly selected college freshmen thought that capital punishment…
A: Given data : x1= 590 n1= 1000 x2= 480 n2= 1000
Q: Here are summary statistics for randomly selected weights of newborn girls: n 236, x= 30.3 hg, s=6.1…
A: The provided sample mean is = 30.3 Population standard deviation is S = 6.1 The size of the sample…
Q: Collect data from 15 of your classmates as shown below and answer the following problem. Show…
A: Given information: Number of students Number of siblings(x) 1 4 2 0 3 3 4 1 5 0 6 0…
Q: . A researcher wishes to find out whether or not there is significance difference the monthly…
A: Hello! As you have posted more than 3 sub parts, we are answering the first 3 sub-parts. In case…


Trending now
This is a popular solution!

Step by step
Solved in 2 steps with 2 images

- Olympic Pole Vault The graph in Figure 7 indicates that in recent years the winning Olympic men’s pole vault height has fallen below the value predicted by the regression line in Example 2. This might have occurred because when the pole vault was a new event there was much room for improvement in vaulters’ performances, whereas now even the best training can produce only incremental advances. Let’s see whether concentrating on more recent results gives a better predictor of future records. (a) Use the data in Table 2 (page 176) to complete the table of winning pole vault heights shown in the margin. (Note that we are using x=0 to correspond to the year 1972, where this restricted data set begins.) (b) Find the regression line for the data in part ‚(a). (c) Plot the data and the regression line on the same axes. Does the regression line seem to provide a good model for the data? (d) What does the regression line predict as the winning pole vault height for the 2012 Olympics? Compare this predicted value to the actual 2012 winning height of 5.97 m, as described on page 177. Has this new regression line provided a better prediction than the line in Example 2?Compute the least-squares regression line for predicting y from x given the following summary statistics. Round the slope and y -intercept to at least four decimal places. =x8.2 =sx3 =y1350 =sy13,000 =r0.40If the standard error of the estimate for a regression model fitted to a large number of paired observations is 1.75, approximately 95% of the residuals would lie within ______. −3.50 and +3.50 −1.75 and +1.75 −0.95 and +0.95 −0.68 and +0.68 −0.97 and +0.97
- Compute the least-squares regression equation for the given data set. Round the slope and y-intercept to at least four decimal places. 2 4 7 6 6 5 3 3 4 2The Update to the Task Force Report on Blood Pressure Control in Children [12] reported the observed 90th per-centile of SBP in single years of age from age 1 to 17 based on prior studies. The data for boys of average height are given in Table 11.18. Suppose we seek a more efficient way to display the data and choose linear regression to accomplish this task. age sbp 1 99 2 102 3 105 4 107 5 108 6 110 7 111 8 112 9 114 10 115 11 117 12 120 13 122 14 125 15 127 16 130 17 132 Do you think the linear regression provides a good fit to the data? Why or why not? Use residual analysis to justify your answer. Am I supposed to run a residual plot and QQ-plot for this question?A researcher notes that, in a certain region, a disproportionate number of software millionaires were born around the year 1955. Is this a coincidence, or does birth year matter when gauging whether a software founder will besuccessful? The researcher investigated this question by analyzing the data shown in the accompanying table. Complete parts a through c below. a. Find the coefficient of determination for the simple linear regression model relating number (y) of software millionaire birthdays in a decade to total number (x) of births in the region. Interpret the result. The coefficient of determination is 1.___? (Round to three decimal places as needed.) This value indicates that 2.____ of the sample variation in the number of software millionaire birthdays is explained by the linear relationship with the total number of births in the region. (Round to one decimal place as needed.) b. Find the coefficient of determination for the simple linear regression model…
- The owner of Showtime Movie Theaters, Inc., would like to predict weekly gross revenueas a function of advertising expenditures. Historical data for a sample of eight weeks follow. Weekly GrossRevenue($1000s) Television Advertising($1000s) Newspaper Advertising($1000s) 96 5.0 1.5 90 2.0 2.0 95 4.0 1.5 92 2.5 2.5 95 3.0 3.3 94 3.5 2.3 94 2.5 4.2 94 3.0 2.5 a. Develop an estimated regression equation with the amount of televisionadvertising as the independent variable.b. Develop an estimated regression equation with both television advertising and newspaper advertising as the independent variables. c. Is the estimated regression equation coefficient for television advertisingexpenditures the same in part (a) and in part (b)? Interpret the coefficient in each case. d. Predict weekly gross revenue for a week when $3500 is spent on television advertising and $1800 is spent on newspaper advertising.What is the slope of the least-squares regression line for these data? Carry your intermediate computations to at least four decimal places and round your answer to at least three decimal places.What is the slope of the least-squares regression line for these data? Carry your intermediate computations to at least four decimal places and round your answer to at least two decimal places.
- Determine the equation of the regression line for the following data, and compute the residuals. x 14 8 19 12 5 y 47 34 59 43 23 Do not round the intermediate values. (Round your answers to 3 decimal places.) y^= +( )x Do not round the intermediate values. (Round your answers to 3 decimal places.) x y Residuals 14 47 8 34 19 59 12 43 5 23The systolic blood pressure dataset (in the third sheet of the spreadsheet linked above) contains the systolic blood pressure and age of 30 randomly selected patients in a medical facility. What is the equation for the least square regression line where the independent or predictor variable is age and the dependent or response variable is systolic blood pressure? Y=__________ X + ______________ Patient 7 is 67 years old and has a systolic blood pressure of 170 mm Hg. What is the residual? __________ mm Hg Is the actual value above, below, or on the line? What is the interpretation of the residual? (difference in actual &predicated bp, difference in age, the amount of systolic changes)

