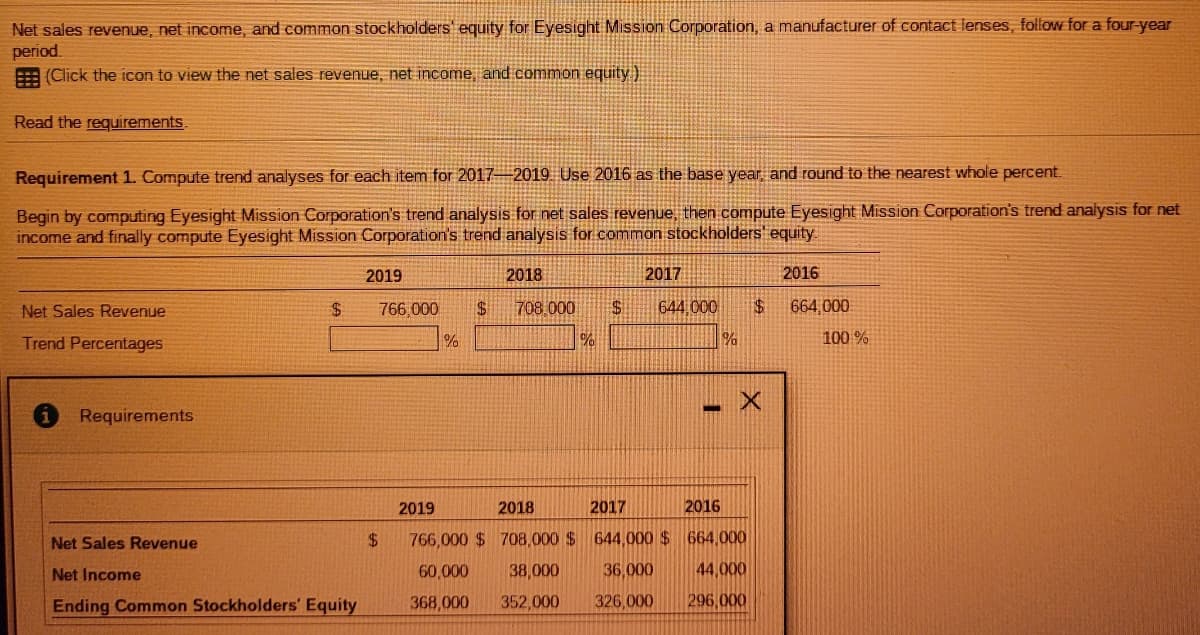
Compute trend analyses for each item for 2017-2019 Use 2016 as the base year, and round to the nearest whole percent.

Financial Reporting, Financial Statement Analysis and Valuation
8th Edition
ISBN:9781285190907
Author:James M. Wahlen, Stephen P. Baginski, Mark Bradshaw
Publisher:James M. Wahlen, Stephen P. Baginski, Mark Bradshaw
Chapter13: Valuation: Earnings-based Approach
Section: Chapter Questions
Problem 1FIC
icon
Related questions
icon
Concept explainers
Question
Net sales revenue, net income, and common stockholders' equity for Eyesight Mission Corporation, a manufacturer of contact lenses, follow for a four-year
period.
E (Click the icon to view the net sales revenue, net income, and common equity)
Read the requirements.
Requirement 1. Compute trend analyses for each item for 2017 2019 Use 2016 as the base year, and round to the nearest whole percent.
Begin by computing Eyesight Mission Corporation's trend analysis for net sales revenue, then compute Eyesight Mission Corporation's trend analysis for net
income and finally compute Eyesight Mission Corporation's trend analysis for common stockholders' equity
2019
2018
2017
2016
Net Sales Revenue
$4
766,000
$4
708 000
644 000
664,000
Trend Percentages
100 %
Requirements
2019
2018
2017
2016
766,000 $ 708,000 $ 644,000 $ 664,000
44,000
Net Sales Revenue
$4
Net Income
60,000
38,000
36,000
Ending Common Stockholders' Equity
368,000
352,000
326,000
296,000
Transcribed Image Text:Net sales revenue, net income, and common stockholders' equity for Eyesight Mission Corporation, a manufacturer of contact lenses, follow for a four-year period. E (Click the icon to view the net sales revenue, net income, and common equity) Read the requirements. Requirement 1. Compute trend analyses for each item for 2017 2019 Use 2016 as the base year, and round to the nearest whole percent. Begin by computing Eyesight Mission Corporation's trend analysis for net sales revenue, then compute Eyesight Mission Corporation's trend analysis for net income and finally compute Eyesight Mission Corporation's trend analysis for common stockholders' equity 2019 2018 2017 2016 Net Sales Revenue $4 766,000 $4 708 000 644 000 664,000 Trend Percentages 100 % Requirements 2019 2018 2017 2016 766,000 $ 708,000 $ 644,000 $ 664,000 44,000 Net Sales Revenue $4 Net Income 60,000 38,000 36,000 Ending Common Stockholders' Equity 368,000 352,000 326,000 296,000
Expert Solution
trending now

Trending now

This is a popular solution!

steps

Step by step

Solved in 2 steps

Blurred answer
Knowledge Booster
Receivables Management
Learn more about
Need a deep-dive on the concept behind this application? Look no further. Learn more about this topic, accounting and related others by exploring similar questions and additional content below.
Similar questions
  • SEE MORE QUESTIONS
Recommended textbooks for you
Financial Reporting, Financial Statement Analysis…
Finance
ISBN:
9781285190907
Author:
James M. Wahlen, Stephen P. Baginski, Mark Bradshaw
Publisher:
Cengage Learning
Pfin (with Mindtap, 1 Term Printed Access Card) (…
Finance
ISBN:
9780357033609
Author:
Randall Billingsley, Lawrence J. Gitman, Michael D. Joehnk
Publisher:
Cengage Learning
Cornerstones of Financial Accounting
Accounting
ISBN:
9781337690881
Author:
Jay Rich, Jeff Jones
Publisher:
Cengage Learning
Financial Management: Theory & Practice
Finance
ISBN:
9781337909730
Author:
Brigham
Publisher:
Cengage
Principles of Accounting Volume 1
Accounting
ISBN:
9781947172685
Author:
OpenStax
Publisher:
OpenStax College