
Managerial Accounting: The Cornerstone of Business Decision-Making
7th Edition
ISBN:9781337115773
Author:Maryanne M. Mowen, Don R. Hansen, Dan L. Heitger
Publisher:Maryanne M. Mowen, Don R. Hansen, Dan L. Heitger
Chapter15: Financial Statement Analysis
Section: Chapter Questions
Problem 40E: Cuneo Companys income statements for the last 3 years are as follows: Refer to the information for...

Related questions
Question
Question 6 HW
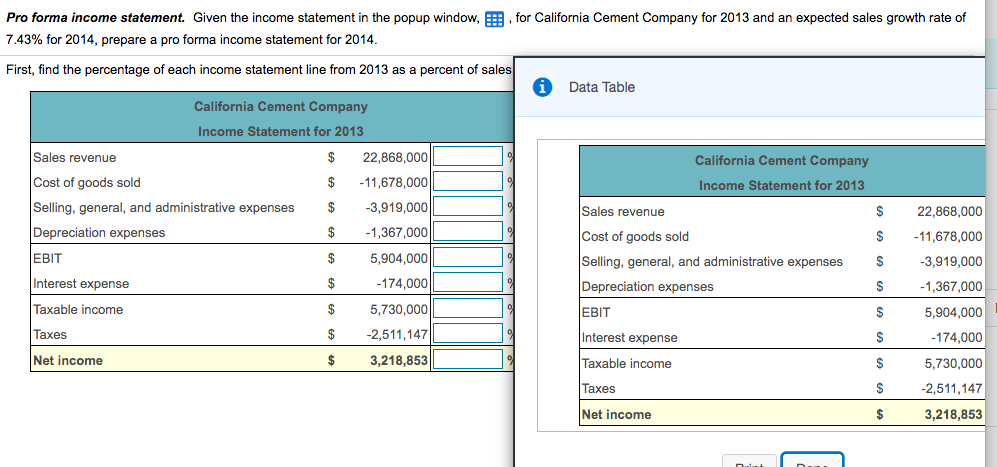
Transcribed Image Text:Pro forma income statement. Given the income statement in the popup window, E, for California Cement Company for 2013 and an expected sales growth rate of
7.43% for 2014, prepare a pro forma income statement for 2014.
First, find the percentage of each income statement line from 2013 as a percent of sales
Data Table
California Cement Company
Income Statement for 2013
Sales revenue
22,868,000
-11,678,000
$
California Cement Company
Cost of goods sold
$
Income Statement for 2013
Selling, general, and administrative expenses
$
-3,919,000
Sales revenue
22,868,000
Depreciation expenses
$
-1,367,000
Cost of goods sold
2$
-11,678,000
EBIT
$
5,904,000|
Selling, general, and administrative expenses
$
-3,919,000
Interest expense
$
-174.000
Depreciation expenses
$
-1,367,000
Taxable income
Taxes
$
5,730,000
EBIT
5,904,000
$
-2,511,147
Interest expense
$
-174,000
Net income
$
3,218,853
Taxable income
5,730,000
Taxes
$
-2,511,147
Net income
$
3,218,853
Duin
Expert Solution
This question has been solved!
Explore an expertly crafted, step-by-step solution for a thorough understanding of key concepts.

This is a popular solution!

Trending now
This is a popular solution!

Step by step
Solved in 2 steps

Knowledge Booster


Learn more about
Need a deep-dive on the concept behind this application? Look no further. Learn more about this topic, finance and related others by exploring similar questions and additional content below.Recommended textbooks for you
Managerial Accounting: The Cornerstone of Busines…
Accounting
ISBN:
9781337115773
Author:
Maryanne M. Mowen, Don R. Hansen, Dan L. Heitger
Publisher:
Cengage Learning

Managerial Accounting
Accounting
ISBN:
9781337912020
Author:
Carl Warren, Ph.d. Cma William B. Tayler
Publisher:
South-Western College Pub

Managerial Accounting: The Cornerstone of Busines…
Accounting
ISBN:
9781337115773
Author:
Maryanne M. Mowen, Don R. Hansen, Dan L. Heitger
Publisher:
Cengage Learning
Managerial Accounting
Accounting
ISBN:
9781337912020
Author:
Carl Warren, Ph.d. Cma William B. Tayler
Publisher:
South-Western College Pub

Survey of Accounting (Accounting I)
Accounting
ISBN:
9781305961883
Author:
Carl Warren
Publisher:
Cengage Learning

Cornerstones of Financial Accounting
Accounting
ISBN:
9781337690881
Author:
Jay Rich, Jeff Jones
Publisher:
Cengage Learning