Computer output for fitting a simple linear model is given below. State the value of the sample slope for this model and give the null and alternative hypotheses for testing if the slope in the population is different from zero. Identify the p-value and use it (and a 5% significance level) to make a clear conclusion about the effectiveness of the model. The regression equation is Predictor Coef Constant X SE Coef T P 83.49 11.98 6.97 0.000 -0.01592 0.01327 -1.20 0.245 Sample slope: p-value: Y = 83.5 0.0159X. Does X appear to be an effective predictor of
Computer output for fitting a simple linear model is given below. State the value of the sample slope for this model and give the null and alternative hypotheses for testing if the slope in the population is different from zero. Identify the p-value and use it (and a 5% significance level) to make a clear conclusion about the effectiveness of the model. The regression equation is Predictor Coef Constant X SE Coef T P 83.49 11.98 6.97 0.000 -0.01592 0.01327 -1.20 0.245 Sample slope: p-value: Y = 83.5 0.0159X. Does X appear to be an effective predictor of

Glencoe Algebra 1, Student Edition, 9780079039897, 0079039898, 2018
18th Edition
ISBN:9780079039897
Author:Carter
Publisher:Carter
Chapter4: Equations Of Linear Functions
Section4.6: Regression And Median-fit Lines
Problem 17HP

Related questions
Question
100%
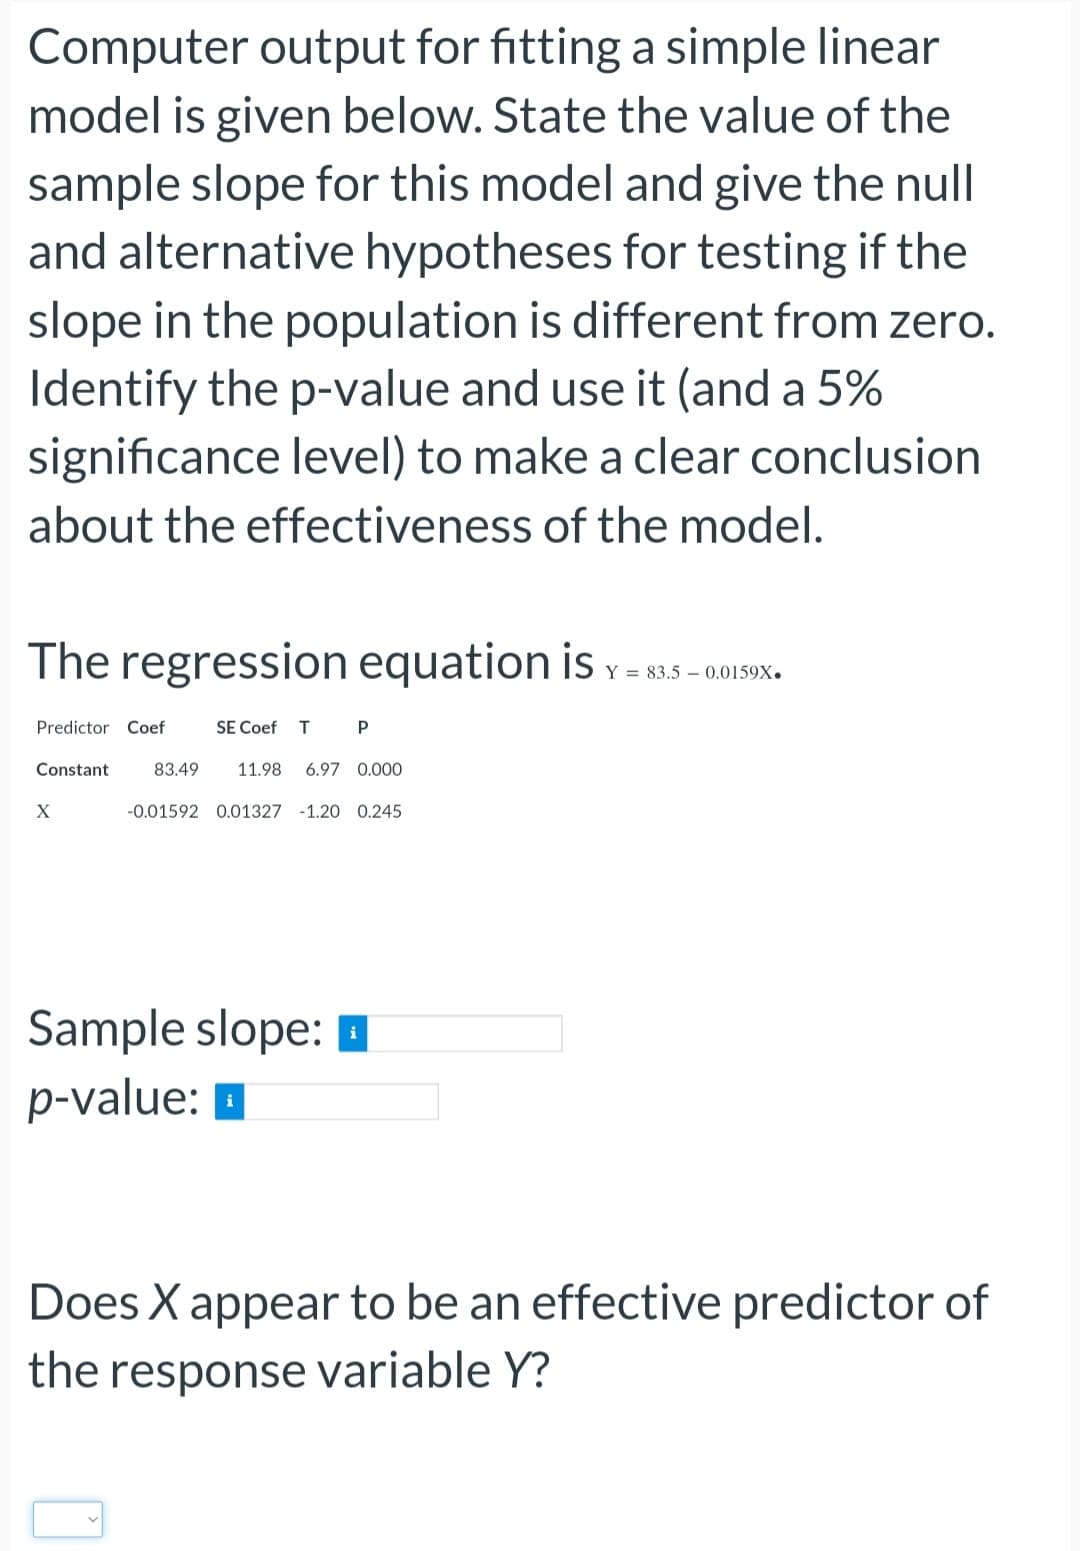
Transcribed Image Text:Computer output for fitting a simple linear
model is given below. State the value of the
sample slope for this model and give the null
and alternative hypotheses for testing if the
slope in the population is different from zero.
Identify the p-value and use it (and a 5%
significance level) to make a clear conclusion
about the effectiveness of the model.
The regression equation is Y=83.5 -0.0159X
Predictor Coef
Constant
X
SE Coef T P
83.49 11.98 6.97 0.000
-0.01592 0.01327 -1.20 0.245
Sample slope:
p-value:
Does X appear to be an effective predictor of
the response variable Y?
Expert Solution
This question has been solved!
Explore an expertly crafted, step-by-step solution for a thorough understanding of key concepts.

Step by step
Solved in 2 steps with 2 images

Recommended textbooks for you
Glencoe Algebra 1, Student Edition, 9780079039897…
Algebra
ISBN:
9780079039897
Author:
Carter
Publisher:
McGraw Hill


College Algebra
Algebra
ISBN:
9781305115545
Author:
James Stewart, Lothar Redlin, Saleem Watson
Publisher:
Cengage Learning
Glencoe Algebra 1, Student Edition, 9780079039897…
Algebra
ISBN:
9780079039897
Author:
Carter
Publisher:
McGraw Hill
College Algebra
Algebra
ISBN:
9781305115545
Author:
James Stewart, Lothar Redlin, Saleem Watson
Publisher:
Cengage Learning