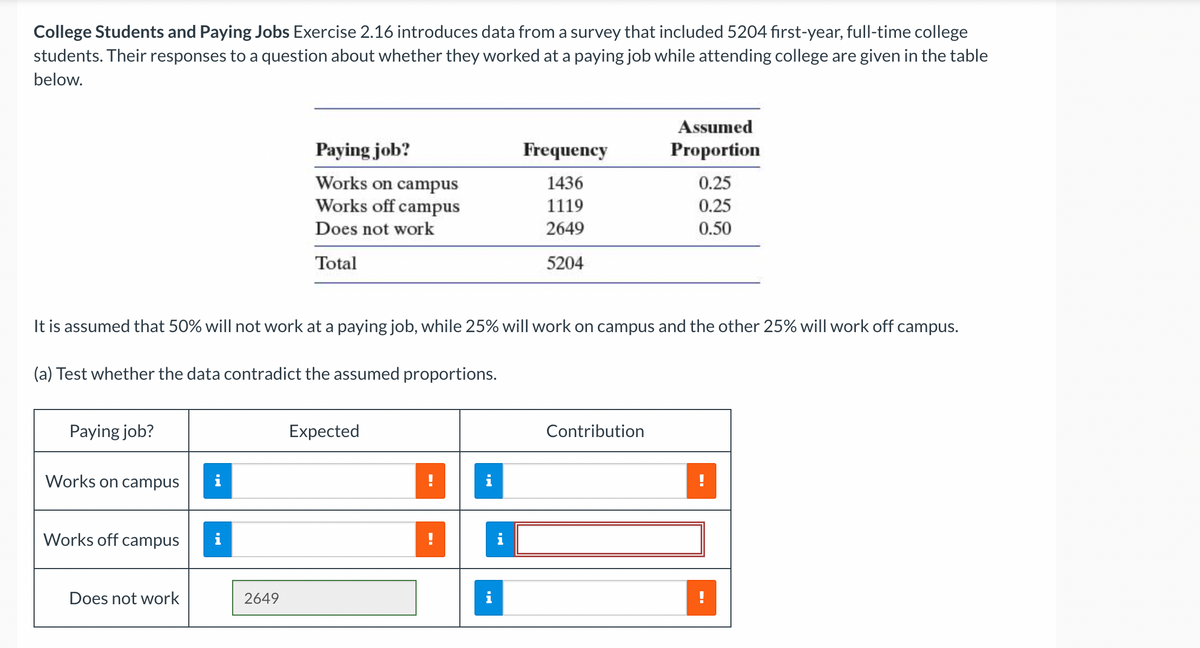
College Students and Paying Jobs Exercise 2.16 introduces data from a survey that included 5204 first-year, full-time college students. Their responses to a question about whether they worked at a paying job while attending college are given in the table below. Paying job? Works on campus Works off campus It is assumed that 50% will not work at a paying job, while 25% will work on campus and the other 25% will work off campus. (a) Test whether the data contradict the assumed proportions. Does not work i Paying job? Works on campus Works off campus Does not work Total 2649 Expected ! ! i i Frequency 1436 1119 2649 5204 i Assumed Proportion Contribution 0.25 0.25 0.50
College Students and Paying Jobs Exercise 2.16 introduces data from a survey that included 5204 first-year, full-time college students. Their responses to a question about whether they worked at a paying job while attending college are given in the table below. Paying job? Works on campus Works off campus It is assumed that 50% will not work at a paying job, while 25% will work on campus and the other 25% will work off campus. (a) Test whether the data contradict the assumed proportions. Does not work i Paying job? Works on campus Works off campus Does not work Total 2649 Expected ! ! i i Frequency 1436 1119 2649 5204 i Assumed Proportion Contribution 0.25 0.25 0.50

Holt Mcdougal Larson Pre-algebra: Student Edition 2012
1st Edition
ISBN:9780547587776
Author:HOLT MCDOUGAL
Publisher:HOLT MCDOUGAL
Chapter11: Data Analysis And Probability
Section: Chapter Questions
Problem 8CR

Related questions
Question
Transcribed Image Text:College Students and Paying Jobs Exercise 2.16 introduces data from a survey that included 5204 first-year, full-time college
students. Their responses to a question about whether they worked at a paying job while attending college are given in the table
below.
Paying job?
Works on campus
Works off campus
It is assumed that 50% will not work at a paying job, while 25% will work on campus and the other 25% will work off campus.
(a) Test whether the data contradict the assumed proportions.
Does not work
M.
Paying job?
Works on campus
Works off campus
Does not work
Total
2649
Expected
Frequency
1436
1119
2649
5204
!
Assumed
Proportion
Contribution
0.25
0.25
0.50
Transcribed Image Text:Favorite Skittles Flavor
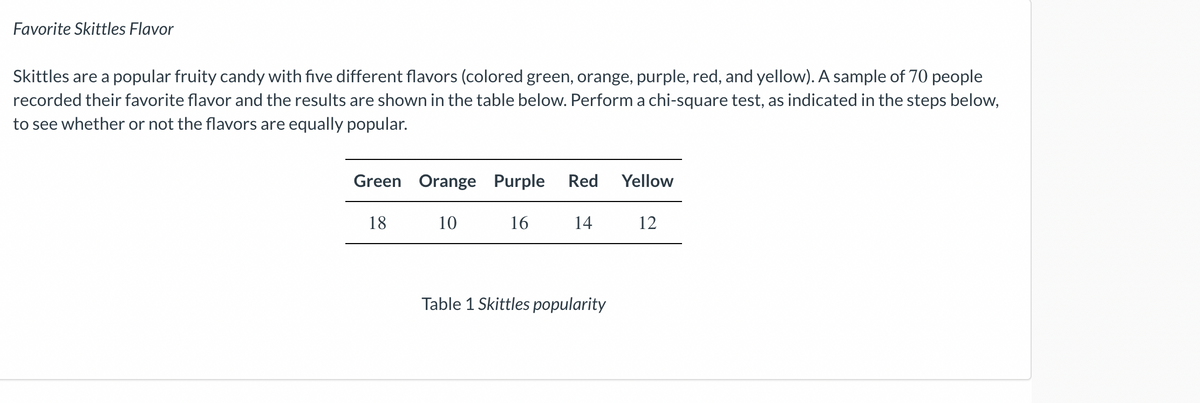
Skittles are a popular fruity candy with five different flavors (colored green, orange, purple, red, and yellow). A sample of 70 people
recorded their favorite flavor and the results are shown in the table below. Perform a chi-square test, as indicated in the steps below,
to see whether or not the flavors are equally popular.
Green Orange Purple Red
10
16
14
18
Table 1 Skittles popularity
Yellow
12
Expert Solution
This question has been solved!
Explore an expertly crafted, step-by-step solution for a thorough understanding of key concepts.

This is a popular solution!

Trending now
This is a popular solution!

Step by step
Solved in 3 steps with 1 images

Recommended textbooks for you
Holt Mcdougal Larson Pre-algebra: Student Edition…
Algebra
ISBN:
9780547587776
Author:
HOLT MCDOUGAL
Publisher:
HOLT MCDOUGAL

College Algebra (MindTap Course List)
Algebra
ISBN:
9781305652231
Author:
R. David Gustafson, Jeff Hughes
Publisher:
Cengage Learning
Holt Mcdougal Larson Pre-algebra: Student Edition…
Algebra
ISBN:
9780547587776
Author:
HOLT MCDOUGAL
Publisher:
HOLT MCDOUGAL
College Algebra (MindTap Course List)
Algebra
ISBN:
9781305652231
Author:
R. David Gustafson, Jeff Hughes
Publisher:
Cengage Learning