Conclusion: Based on your findings on ratio analysis and interpretation, what conclusion can you make?
Conclusion: Based on your findings on ratio analysis and interpretation, what conclusion can you make?

Cornerstones of Financial Accounting
4th Edition
ISBN:9781337690881
Author:Jay Rich, Jeff Jones
Publisher:Jay Rich, Jeff Jones
Chapter11: The Statement Of Cash Flows
Section: Chapter Questions
Problem 26BE

Related questions
Question
IV. Conclusion:
Based on your findings on ratio analysis and interpretation, what conclusion can you make?
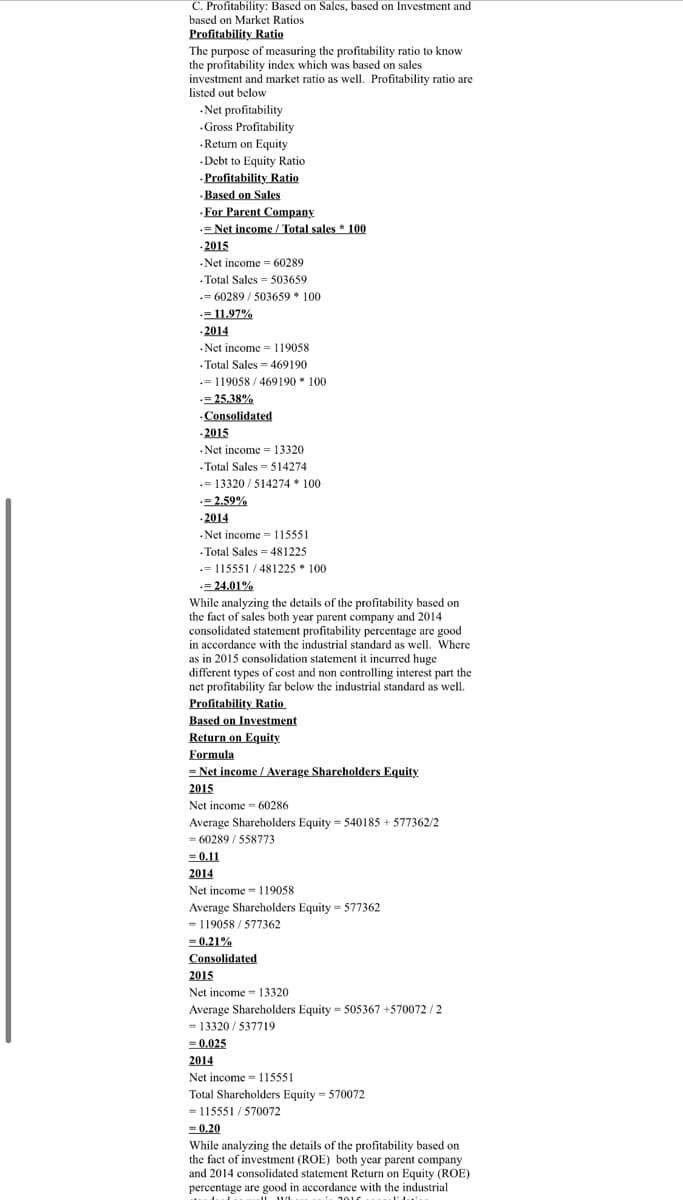
Transcribed Image Text:C. Profitability: Based on Sales, based on Investment
based on Market Ratios
Profitability Ratio
The purpose of measuring the profitability ratio to know
the profitability index which was based
investment and market ratio as well. Profitability ratio are
listed out below
sales
.Net profitability
.Gross Profitability
·Return on Equity
.Debt to Equity Ratio
.Profitability Ratio
·Based on Sales
·For Parent Company
= Net income / Total sales * 100
-2015
Net income = 60289
.Total Sales = 503659
.= 60289 / 503659 * 100
=11.97%
- 2014
-Net income = 119058
· Total Sales = 469190
.= 119058 / 469190 * 100
= 25.38%
Consolidated
- 2015
- Net income = 13320
- Total Sales 514274
= 13320 / 514274 * 100
-=2.59%
-2014
Net income 115551
.Total Sales = 481225
.= 115551 / 481225 * 100
-= 24.01%
While analyzing the details of the profitability based on
the fact of sales both year parent company and 2014
consolidated statement profitability percentage are good
in accordance with the industrial standard as well. Where
as in 2015 consolidation statement it incurred huge
different types of cost and non controlling interest part the
net profitability far below the industrial standard as well.
Profitability Ratio
Based on Investment
Return on Equity
Formula
= Net income / Average Shareholders Equity
2015
Net income = 60286
Average Shareholders Equity = 540185 + 577362/2
= 60289 / 558773
= 0.11
2014
Net income = 119058
Average Sharcholders Equity = 577362
= 119058 / 577362
= 0.21%
Consolidated
2015
Net income = 13320
Average Shareholders Equity = 505367 +570072 / 2
= 13320 / 537719
= 0.025
2014
Net income = 115551
Total Shareholders Equity = 570072
115551 / 570072
= 0,20
=
While analyzing the details of the profitability based on
the fact of investment (ROE) both year parent company
and 2014 consolidated statement Return on Equity (ROE)
percentage are good in accordance with the industrial
2010
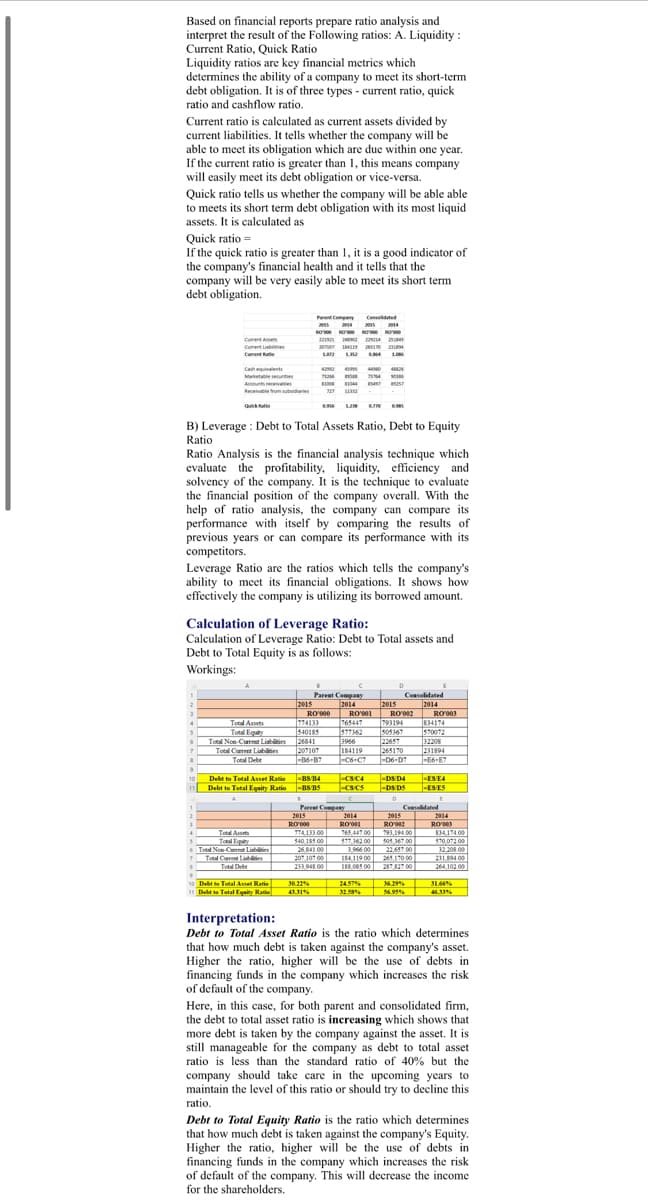
Transcribed Image Text:Based on financial reports prepare ratio analysis and
interpret the result of the Following ratios: A. Liquidity :
Current Ratio, Quick Ratio
Liquidity ratios are key financial metrics which
determines the ability of a company to meet its short-term
debt obligation. It is of three types - current ratio, quick
ratio and cashflow ratio.
Current ratio is calculated as current assets divided by
current liabilities. It tells whether the company will be
able to meet its obligation which are due within one year.
If the current ratio is greater than 1, this means company
will easily meet its debt obligation or vice-versa.
Quick ratio tells us whether the company will be able able
to meets its short term debt obligation with its most liquid
assets. It is calculated as
Quick ratio =
If the quick ratio is greater than 1, it is a good indicator of
the company's financial health and it tells that the
company will be very easily able to meet its short term
debt obligation.
Parent Company Conated
20s 24 2s 214
4
RO ROe so o
Cument Ase
22I 4 a
Cument ebe
Cument te
sara La 10
s 42
Cah equivalents
Matetable secunties
Accounts receivles
Recelvale om ubdaries
L2M e
Quic atio
B) Leverage : Debt to Total Assets Ratio, Debt to Equity
Ratio
Ratio Analysis is the financial analysis technique which
evaluate the profitability, liquidity, efficiency and
solvency of the company. It is the technique to evaluate
the financial position of the company overall. With the
help of ratio analysis, the company can compare
performance with itself by comparing the results of
previous years or can compare its performance with its
competitors.
Leverage Ratio are the ratios which tells the company's
ability to meet its financial obligations. It shows how
effectively the company is utilizing its borrowed amount.
Calculation of Leverage Ratio:
Calculation of Leverage Ratio: Debt to Total assets and
Debt to Total Equity is as follows:
Workings:
Pareat Company
Cossolidated
2015 2014 2015
2014
774133
I540185
26841
207107
|RO'00 RO'001 RO'002 ROV03
793194
505367
22657
765447
57762
3966
184119 265170 231894
1-C6+C7 -D6-D? -E6-E7
834174
570072
32208
Total Assets
Total Eouiy
Total Non-Curet Liabities
7
Total Carent Liabliies
Total Debe
10 -BS B4
Debt to Total Asset Ratio
-CSC4 -DS D4 4
-ESE4
Debt to Total Equity Ratio -BS B5
-CSCS -DS DS
-ESES
Paret Compaay
Cesolidated
2015 2014 2015 2014
RO00 RO01 RO002 RO'0S
774133.00 193,194.00
Tetl Aset
765,447 00
S40.185 00 S77,362 00 s05,367 00
Total Fquity
Total Non-Cemt Lisbilitien
Tol Curet Labes
134174.00
170.072 00
3220 00
231894 00
264 102 00
26,841.00
3,966 00 22,657.00
207.107 00 184119 00 265,170 00
188,085 00
Total Deb
233 948 00
287 827.00
no Debt to Total Asset Ratie 30.22 2457% 36 19% 31.66%
Delt te Tatal Equity Ratie
36.19%
4% 32.8% 4.95% 4.U
Interpretation:
Debt to Total Asset Ratio is the ratio which determines
that how much debt is taken against the company's asset.
Higher the ratio, higher will be the use of debts in
financing funds in the company which increases the risk
of default of the company.
Here, in this case, for both parent and consolidated firm,
the debt to total asset ratio is increasing which shows that
more debt is taken by the company against the asset. It is
still manageable for the company as debt to total asset
ratio is less than the standard ratio of 40% but the
company should take care in the upcoming years to
maintain the level of this ratio or should try to decline this
ratio.
Debt to Total Equity Ratio is the ratio which determines
that how much debt is taken against the company's Equity.
Higher the ratio, higher will be the use of debts in
financing funds in the company which increases the risk
of default of the company. This will decrease the income
for the shareholders.
Expert Solution
This question has been solved!
Explore an expertly crafted, step-by-step solution for a thorough understanding of key concepts.

Step by step
Solved in 2 steps

Knowledge Booster


Learn more about
Need a deep-dive on the concept behind this application? Look no further. Learn more about this topic, accounting and related others by exploring similar questions and additional content below.Recommended textbooks for you
Cornerstones of Financial Accounting
Accounting
ISBN:
9781337690881
Author:
Jay Rich, Jeff Jones
Publisher:
Cengage Learning

Financial Accounting: The Impact on Decision Make…
Accounting
ISBN:
9781305654174
Author:
Gary A. Porter, Curtis L. Norton
Publisher:
Cengage Learning

Intermediate Financial Management (MindTap Course…
Finance
ISBN:
9781337395083
Author:
Eugene F. Brigham, Phillip R. Daves
Publisher:
Cengage Learning
Cornerstones of Financial Accounting
Accounting
ISBN:
9781337690881
Author:
Jay Rich, Jeff Jones
Publisher:
Cengage Learning
Financial Accounting: The Impact on Decision Make…
Accounting
ISBN:
9781305654174
Author:
Gary A. Porter, Curtis L. Norton
Publisher:
Cengage Learning
Intermediate Financial Management (MindTap Course…
Finance
ISBN:
9781337395083
Author:
Eugene F. Brigham, Phillip R. Daves
Publisher:
Cengage Learning

Financial Accounting
Accounting
ISBN:
9781337272124
Author:
Carl Warren, James M. Reeve, Jonathan Duchac
Publisher:
Cengage Learning


EBK CONTEMPORARY FINANCIAL MANAGEMENT
Finance
ISBN:
9781337514835
Author:
MOYER
Publisher:
CENGAGE LEARNING - CONSIGNMENT