Conduct the hypothesis test and provide the test statistic and the critical value, and state the conclusion. A company claims that its packages of 100 candies are distributed with the following color percentages: 12% red, 19% orange, 13% yellow, 15% brown, 23% blue, and 18% green. Use the given sample data to test the claim that the color distribution is as claimed. Use a 0.025 significance level.
Conduct the hypothesis test and provide the test statistic and the critical value, and state the conclusion. A company claims that its packages of 100 candies are distributed with the following color percentages: 12% red, 19% orange, 13% yellow, 15% brown, 23% blue, and 18% green. Use the given sample data to test the claim that the color distribution is as claimed. Use a 0.025 significance level.

College Algebra (MindTap Course List)
12th Edition
ISBN:9781305652231
Author:R. David Gustafson, Jeff Hughes
Publisher:R. David Gustafson, Jeff Hughes
Chapter8: Sequences, Series, And Probability
Section8.7: Probability
Problem 5E: List the sample space of each experiment. Rolling one die and tossing one coin

Related questions
Question
Calculate the test statistic
Calculate the critical value
What is the conclusion for this hypothesis test?

Transcribed Image Text:Conduct the hypothesis test and provide the test statistic and the critical value, and state the conclusion.
A company claims that its packages of 100 candies are distributed with the following color percentages: 12% red, 19% orange, 13% yellow, 15% brown, 23% blue, and
18% green. Use the given sample data to test the claim that the color distribution is as claimed. Use a 0.025 significance level.
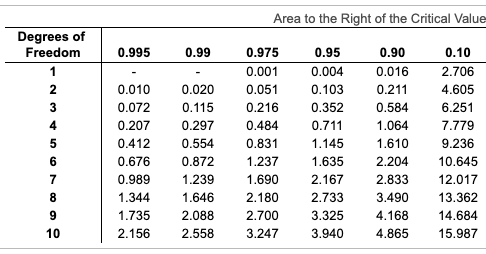
Transcribed Image Text:Area to the Right of the Critical Value
Degrees of
Freedom
0.995
0.99
0.975
0.95
0.90
0.10
1
0.001
0.004
0.016
2.706
2
0.010
0.020
0.051
0.103
0.211
4.605
3
0.072
0.115
0.216
0.352
0.584
6.251
4
0.207
0.297
0.484
0.711
1.064
7.779
0.412
0.554
0.831
1.145
1.610
9.236
0.676
0.872
1.237
1.635
2.204
10.645
7
0.989
1.239
1.690
2.167
2.833
12.017
8
1.344
1.646
2.180
2.733
3.490
13.362
9
1.735
2.088
2.700
3.325
4.168
14.684
10
2.156
2,558
3.247
3.940
4.865
15.987
Expert Solution
This question has been solved!
Explore an expertly crafted, step-by-step solution for a thorough understanding of key concepts.

This is a popular solution!

Trending now
This is a popular solution!

Step by step
Solved in 2 steps with 2 images

Knowledge Booster


Learn more about
Need a deep-dive on the concept behind this application? Look no further. Learn more about this topic, statistics and related others by exploring similar questions and additional content below.Recommended textbooks for you
College Algebra (MindTap Course List)
Algebra
ISBN:
9781305652231
Author:
R. David Gustafson, Jeff Hughes
Publisher:
Cengage Learning

Glencoe Algebra 1, Student Edition, 9780079039897…
Algebra
ISBN:
9780079039897
Author:
Carter
Publisher:
McGraw Hill

College Algebra (MindTap Course List)
Algebra
ISBN:
9781305652231
Author:
R. David Gustafson, Jeff Hughes
Publisher:
Cengage Learning
Glencoe Algebra 1, Student Edition, 9780079039897…
Algebra
ISBN:
9780079039897
Author:
Carter
Publisher:
McGraw Hill