Conduct the hypothesis test and provide the test statistic and the critical value, and state the conclusion. A person randomly selected 100 checks and recorded the cents portions of those checks. The table below lists those cents portions categorized according to the indicated values. Use a 0.05 significance level to test the claim that the four categories are equally likely. The person expected that many checks for whole dollar amounts would result in a disproportionately high frequency for the first category, but do the results support that expectation? C Cents portion of check Number 25-49 24 Click here to view the chi-square distribution table 0-24 30 The test statistic is (Round to three decimal places as needed.) The critical value is (Round to three decimal places as needed.) State the conclusion. 50-74 26 75-99 20 A Ho. There sufficient evidence to warrant rejection of the claim that the four categories are equally likely. The results expectation that the frequency for the first category is disproportionately high. to support the
Conduct the hypothesis test and provide the test statistic and the critical value, and state the conclusion. A person randomly selected 100 checks and recorded the cents portions of those checks. The table below lists those cents portions categorized according to the indicated values. Use a 0.05 significance level to test the claim that the four categories are equally likely. The person expected that many checks for whole dollar amounts would result in a disproportionately high frequency for the first category, but do the results support that expectation? C Cents portion of check Number 25-49 24 Click here to view the chi-square distribution table 0-24 30 The test statistic is (Round to three decimal places as needed.) The critical value is (Round to three decimal places as needed.) State the conclusion. 50-74 26 75-99 20 A Ho. There sufficient evidence to warrant rejection of the claim that the four categories are equally likely. The results expectation that the frequency for the first category is disproportionately high. to support the

College Algebra (MindTap Course List)
12th Edition
ISBN:9781305652231
Author:R. David Gustafson, Jeff Hughes
Publisher:R. David Gustafson, Jeff Hughes
Chapter8: Sequences, Series, And Probability
Section8.7: Probability
Problem 7E: List the sample space of each experiment. Selecting a letter of the alphabet

Related questions
Question
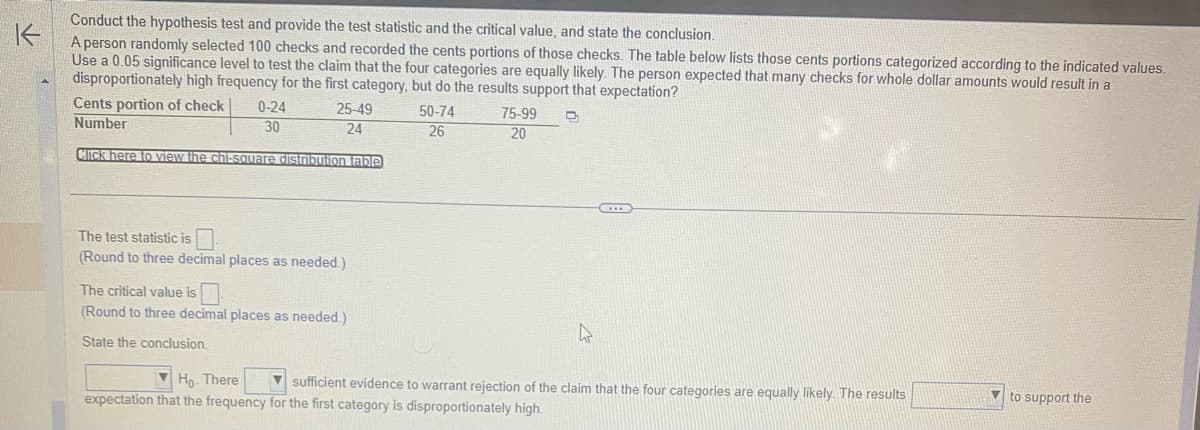
Transcribed Image Text:Conduct the hypothesis test and provide the test statistic and the critical value, and state the conclusion.
K
A person randomly selected 100 checks and recorded the cents portions of those checks. The table below lists those cents portions categorized according to the indicated values.
Use a 0.05 significance level to test the claim that the four categories are equally likely. The person expected that many checks for whole dollar amounts would result in a
disproportionately high frequency for the first category, but do the results support that expectation?
C₂
50-74
26
Cents portion of check
25-49
24
Number
Click here to view the chi-square distribution table
0-24
30
The test statistic is
(Round to three decimal places as needed.)
The critical value is
(Round to three decimal places as needed.)
State the conclusion.
75-99
20
Ho. There
sufficient evidence to warrant rejection of the claim that the four categories are equally likely. The results
expectation that the frequency for the first category is disproportionately high.
to support the
Transcribed Image Text:K
Conduct the hy
A person rando
Use a 0.05 sign
disproportionat
Cents portion
Number
Click here to vi
The test statisti
(Round to three
The critical valu
(Round to three
State the concl
▼
expectation tha
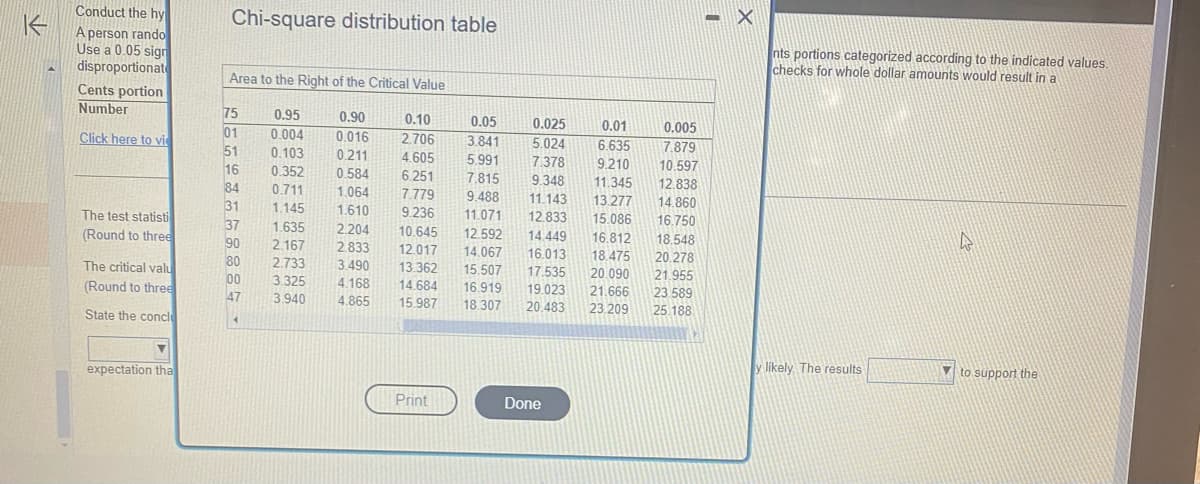
Chi-square distribution table
Area to the Right of the Critical Value
0.95
0.004
0.103
0.352
0.90 0.10 0.05
0.016 2.706 3.841
0.211 4.605 5.991
0.584 6.251
0.711 1.064
1.145 1.610
1.635 2.204
2.167 2.833
2.733
3.490
3.325 4.168
4.865
3.940
75
01
51
16
84
31
37
90
80
00
47
4
0.025
0.01
5.024
6.635
9.210
7.378
7.815 9.348 11.345
13.277
15.086
7.779 9.488 11.143
9.236 11.071 12.833
10.645 12.592 14.449 16.812
12.017 14.067 16.013 18.475
13.362 15.507 17.535 20.090
14.684 16.919 19.023
21.666
18.307 20.483 23.209
15.987
Print
Done
0.005
7.879
10.597
12.838
14.860
16.750
18.548
20.278
21.955
23.589
25 188
-X
nts portions categorized according to the indicated values.
checks for whole dollar amounts would result in a
y likely. The results
4
to support the
Expert Solution
This question has been solved!
Explore an expertly crafted, step-by-step solution for a thorough understanding of key concepts.

This is a popular solution!

Trending now
This is a popular solution!

Step by step
Solved in 2 steps with 2 images

Recommended textbooks for you
College Algebra (MindTap Course List)
Algebra
ISBN:
9781305652231
Author:
R. David Gustafson, Jeff Hughes
Publisher:
Cengage Learning

College Algebra (MindTap Course List)
Algebra
ISBN:
9781305652231
Author:
R. David Gustafson, Jeff Hughes
Publisher:
Cengage Learning