Confidence intervals for a mean: Normal population (u80, o-10) Type%3Z (... Sample size=s CI Level Containing u Total Proportion 0.9 2163 2400 0.9012 60 70 Intervals 2301 to 2400 The following is a graph of Applets simulated confidence intervals a) The value of the hypothesized population mean lo =(Enter an integer) b) The total number of confidence intervals simmulated is, and the percent of these total intervals that contain the population mean is equal to%(keep two digits after decimal point) c) The percent of last 100 intervals that contain the population mean is equal to %(entr an interger) d) In the long run, the percent of all intervals that will contain the population mean is approximate equal to%(entr an interger)
Confidence intervals for a mean: Normal population (u80, o-10) Type%3Z (... Sample size=s CI Level Containing u Total Proportion 0.9 2163 2400 0.9012 60 70 Intervals 2301 to 2400 The following is a graph of Applets simulated confidence intervals a) The value of the hypothesized population mean lo =(Enter an integer) b) The total number of confidence intervals simmulated is, and the percent of these total intervals that contain the population mean is equal to%(keep two digits after decimal point) c) The percent of last 100 intervals that contain the population mean is equal to %(entr an interger) d) In the long run, the percent of all intervals that will contain the population mean is approximate equal to%(entr an interger)

MATLAB: An Introduction with Applications
6th Edition
ISBN:9781119256830
Author:Amos Gilat
Publisher:Amos Gilat
Chapter1: Starting With Matlab
Section: Chapter Questions
Problem 1P

Related questions
Question
100%
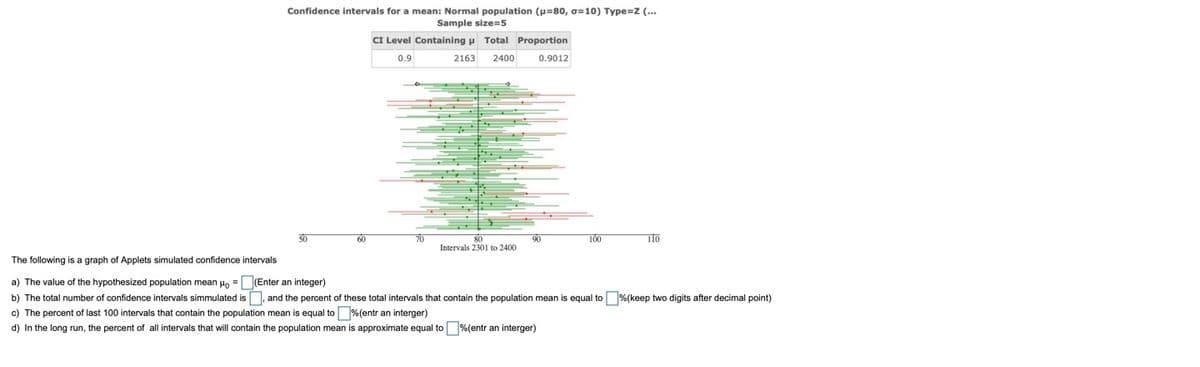
Transcribed Image Text:Confidence intervals for a mean: Normal population (p=80, o=10) Type=z (...
Sample size=5
CI Level Containing p Total Proportion
0.9
2163
2400
0.9012
50
60
70
90
100
T10
80
Intervals 2301 to 2400
The following is a graph of Applets simulated confidence intervals
a) The value of the hypothesized population mean Ho = (Enter an integer)
b) The total number of confidence intervals simmulated is, and the percent of these total intervals that contain the population mean
c) The percent of last 100 intervals that contain the population mean is equal to %(entr an interger)
d) In the long run, the percent of all intervals that will contain the population mean is approximate equal to %(entr an interger)
equal to %(keep two digits after decimal point)
Expert Solution
This question has been solved!
Explore an expertly crafted, step-by-step solution for a thorough understanding of key concepts.

This is a popular solution!

Trending now
This is a popular solution!

Step by step
Solved in 2 steps

Recommended textbooks for you
MATLAB: An Introduction with Applications
Statistics
ISBN:
9781119256830
Author:
Amos Gilat
Publisher:
John Wiley & Sons Inc

Probability and Statistics for Engineering and th…
Statistics
ISBN:
9781305251809
Author:
Jay L. Devore
Publisher:
Cengage Learning

Statistics for The Behavioral Sciences (MindTap C…
Statistics
ISBN:
9781305504912
Author:
Frederick J Gravetter, Larry B. Wallnau
Publisher:
Cengage Learning
MATLAB: An Introduction with Applications
Statistics
ISBN:
9781119256830
Author:
Amos Gilat
Publisher:
John Wiley & Sons Inc
Probability and Statistics for Engineering and th…
Statistics
ISBN:
9781305251809
Author:
Jay L. Devore
Publisher:
Cengage Learning
Statistics for The Behavioral Sciences (MindTap C…
Statistics
ISBN:
9781305504912
Author:
Frederick J Gravetter, Larry B. Wallnau
Publisher:
Cengage Learning

Elementary Statistics: Picturing the World (7th E…
Statistics
ISBN:
9780134683416
Author:
Ron Larson, Betsy Farber
Publisher:
PEARSON

The Basic Practice of Statistics
Statistics
ISBN:
9781319042578
Author:
David S. Moore, William I. Notz, Michael A. Fligner
Publisher:
W. H. Freeman

Introduction to the Practice of Statistics
Statistics
ISBN:
9781319013387
Author:
David S. Moore, George P. McCabe, Bruce A. Craig
Publisher:
W. H. Freeman