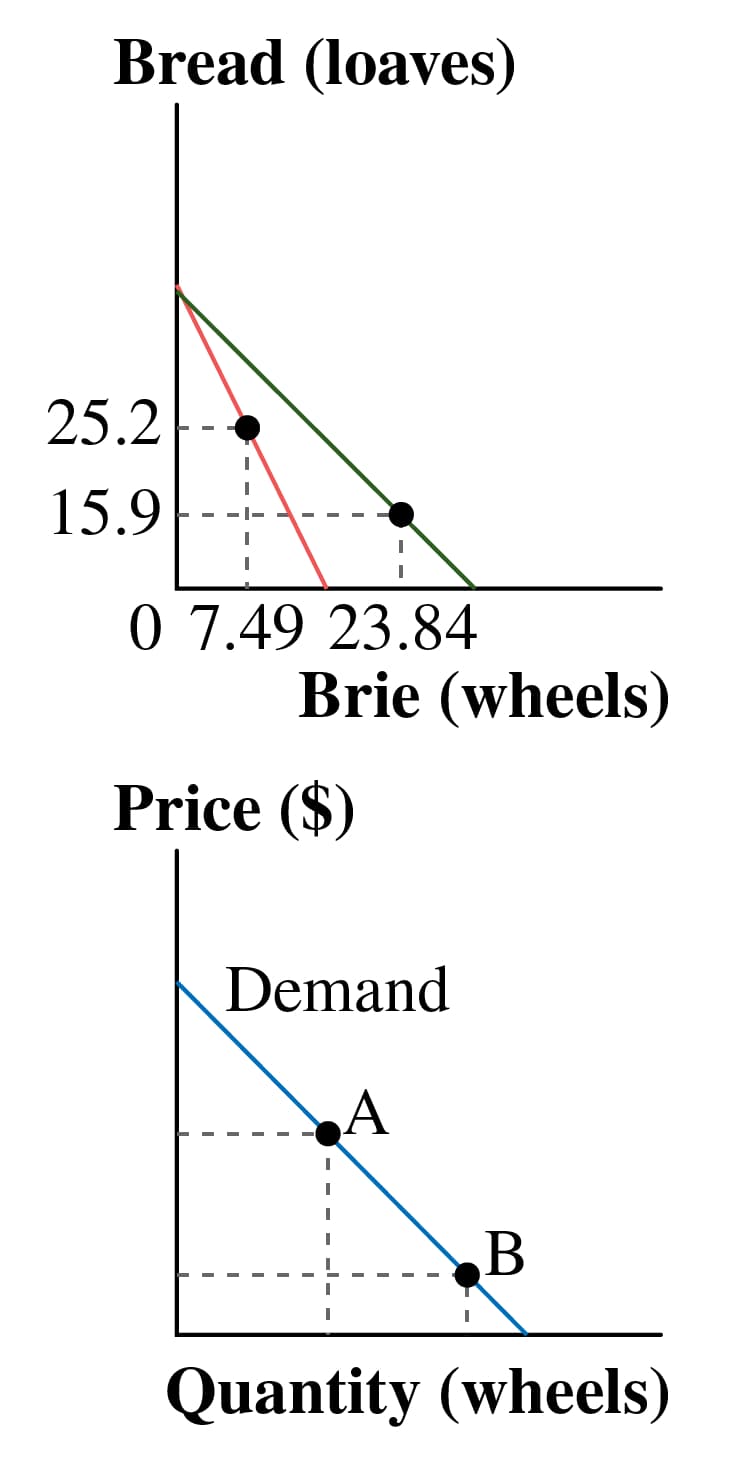
Consider a hypothetical consumer named Hayden who is shopping for bread and brie. The graph with bread and brie on the axes presents the utility‑maximizing combinations of bread and brie that Hayden chooses when the price of bread is $1.00$1.00 per loaf and the price of brie is $4.00$4.00 and $6.00$6.00 per wheel, respectively. The other graph shows Hayden's demand curve for brie. The two points and associated values in the graph for bread and brie combinations correspond to points A and B in the graph of the demand curve for brie. What are the specific prices and quantities of brie associated with points A and B on Hayden's demand curve? price of brie at point A: $$ quantity demanded at point A: price of brie at point B: $$ quantity demanded at point B:


Consider a hypothetical consumer named Hayden who is shopping for bread and brie. The graph with bread and brie on the axes presents the utility‑maximizing combinations of bread and brie that Hayden chooses when the
The two points and associated values in the graph for bread and brie combinations correspond to points A and B in the graph of the demand curve for brie. What are the specific prices and quantities of brie associated with points A and B on Hayden's demand curve?
The graph shows two points and associated values for bread and brie combinations correspond to points A and B in the graph of the demand curve for brie where
The price for the brie is $4 and $6per wheel.
The price for the bread is $1 per loaf

Trending now
This is a popular solution!

Step by step
Solved in 2 steps


