Consider a hypothetical open economy. The following table presents data on the relationship between various real interest rates and national saving, domestic investment, and net capital outflow in this economy, where the currency is the U.S. dollar. Assume that the economy is currently experiencing a balanced government budget. Real Interest Rate National Saving Domestic Investment Net Capital Outflow (Percent) (Billions of dollars) (Billions of dollars) (Billions of dollars) 7 55 25 -15 6 50 30 -10 5 45 35 -5 4 40 40 0 3 35 45 5 2 30 50 10
Consider a hypothetical open economy. The following table presents data on the relationship between various real interest rates and national saving, domestic investment, and net capital outflow in this economy, where the currency is the U.S. dollar. Assume that the economy is currently experiencing a balanced government budget. Real Interest Rate National Saving Domestic Investment Net Capital Outflow (Percent) (Billions of dollars) (Billions of dollars) (Billions of dollars) 7 55 25 -15 6 50 30 -10 5 45 35 -5 4 40 40 0 3 35 45 5 2 30 50 10

Practical Management Science
6th Edition
ISBN:9781337406659
Author:WINSTON, Wayne L.
Publisher:WINSTON, Wayne L.
Chapter2: Introduction To Spreadsheet Modeling
Section: Chapter Questions
Problem 20P: Julie James is opening a lemonade stand. She believes the fixed cost per week of running the stand...

Related questions
Question
100%
18 . Effects of a government budget deficit
Consider a hypothetical open economy. The following table presents data on the relationship between various real interest rates and national saving, domestic investment, and net capital outflow in this economy, where the currency is the U.S. dollar. Assume that the economy is currently experiencing a balanced government budget.
|
Real Interest Rate
|
National Saving
|
Domestic Investment
|
Net Capital Outflow
|
|---|---|---|---|
|
(Percent)
|
(Billions of dollars)
|
(Billions of dollars)
|
(Billions of dollars)
|
| 7 | 55 | 25 | -15 |
| 6 | 50 | 30 | -10 |
| 5 | 45 | 35 | -5 |
| 4 | 40 | 40 | 0 |
| 3 | 35 | 45 | 5 |
| 2 | 30 | 50 | 10 |
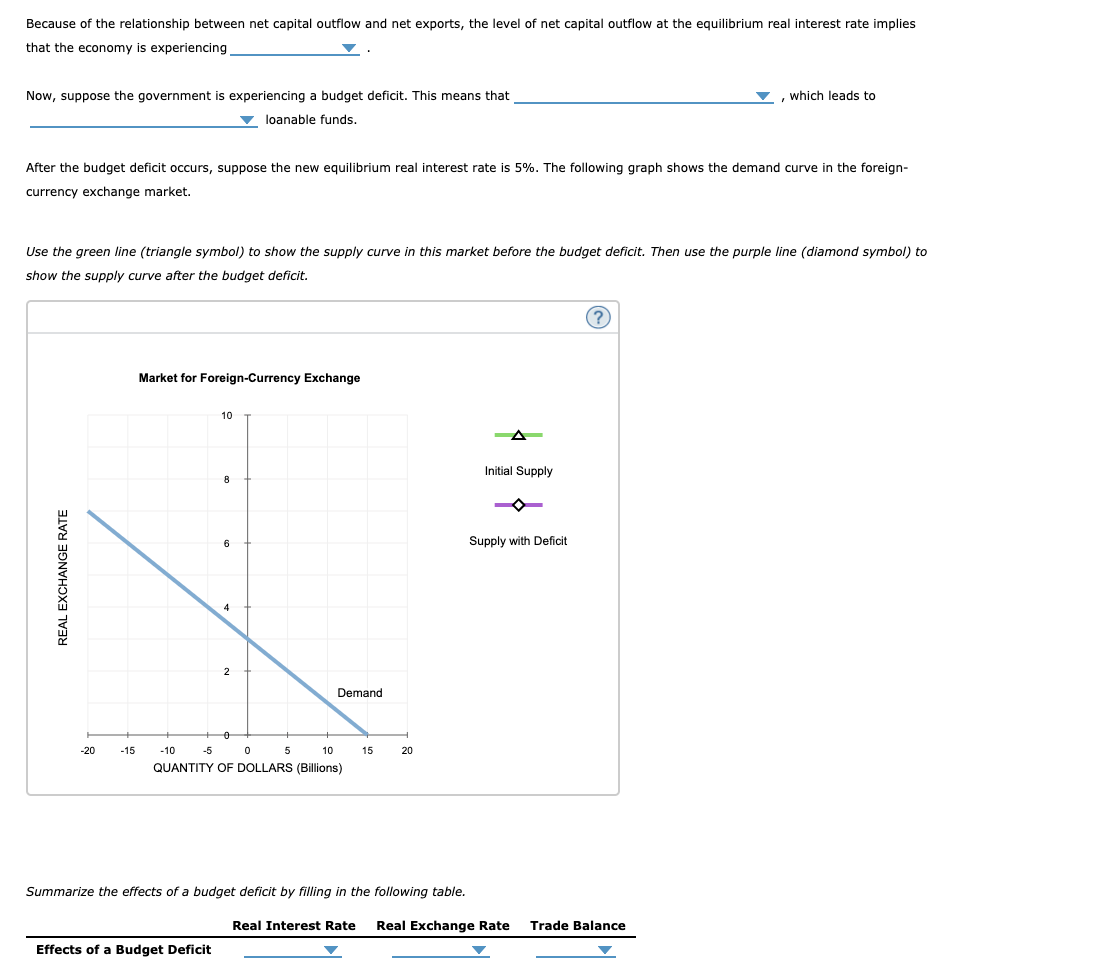
Transcribed Image Text:Because of the relationship between net capital outflow and net exports, the level of net capital outflow at the equilibrium real interest rate implies
that the economy is experiencing
Now, suppose the government is experiencing a budget deficit. This means that
, which leads to
loanable funds.
After the budget deficit occurs, suppose the new equilibrium real interest rate is 5%. The following graph shows the demand curve in the foreign-
currency exchange market.
Use the green line (triangle symbol) to show the supply curve in this market before the budget deficit. Then use the purple line (diamond symbol) to
show the supply curve after the budget deficit.
(?
Market for Foreign-Currency Exchange
10
Initial Supply
8
6
Supply with Deficit
4
2
Demand
-20
-15
-10
-5
5
10
15
20
QUANTITY OF DOLLARS (Billions)
Summarize the effects of a budget deficit by filling in the following table.
Real Interest Rate
Real Exchange Rate
Trade Balance
Effects of a Budget Deficit
REAL EXCHANGE RATE
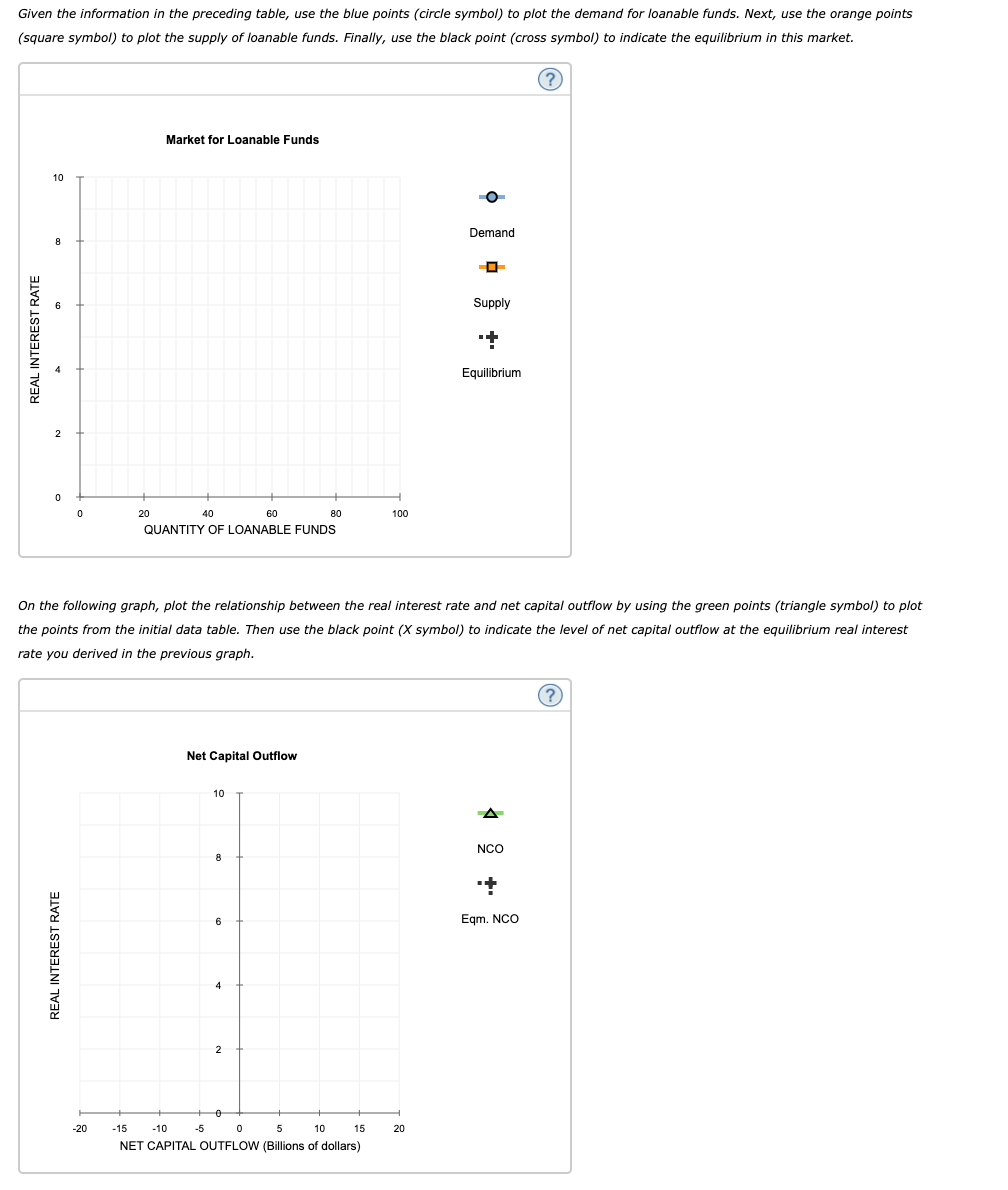
Transcribed Image Text:Given the information in the preceding table, use the blue points (circle symbol) to plot the demand for loanable funds. Next, use the orange points
(square symbol) to plot the supply of loanable funds. Finally, use the black point (cross symbol) to indicate the equilibrium in this market.
Market for Loanable Funds
10
Demand
8
Supply
Equilibrium
20
40
60
80
100
QUANTITY OF LOANABLE FUNDS
On the following graph, plot the relationship between the real interest rate and net capital outflow by using the green points (triangle symbol) to plot
the points from the initial data table. Then use the black point (X symbol) to indicate the level of net capital outflow at the equilibrium real interest
rate vou derived in the previous graph.
(?
Net Capital Outflow
10
NCO
8
6
Eqm. NCO
4
-20
-15
-10
-5
5
10
15
20
NET CAPITAL OUTFLOW (Billions of dollars)
REAL INTEREST RATE
REAL INTEREST RATE
Expert Solution
This question has been solved!
Explore an expertly crafted, step-by-step solution for a thorough understanding of key concepts.

This is a popular solution!

Trending now
This is a popular solution!

Step by step
Solved in 2 steps with 3 images

Knowledge Booster


Learn more about
Need a deep-dive on the concept behind this application? Look no further. Learn more about this topic, operations-management and related others by exploring similar questions and additional content below.Recommended textbooks for you
Practical Management Science
Operations Management
ISBN:
9781337406659
Author:
WINSTON, Wayne L.
Publisher:
Cengage,

Operations Management
Operations Management
ISBN:
9781259667473
Author:
William J Stevenson
Publisher:
McGraw-Hill Education

Operations and Supply Chain Management (Mcgraw-hi…
Operations Management
ISBN:
9781259666100
Author:
F. Robert Jacobs, Richard B Chase
Publisher:
McGraw-Hill Education
Practical Management Science
Operations Management
ISBN:
9781337406659
Author:
WINSTON, Wayne L.
Publisher:
Cengage,
Operations Management
Operations Management
ISBN:
9781259667473
Author:
William J Stevenson
Publisher:
McGraw-Hill Education
Operations and Supply Chain Management (Mcgraw-hi…
Operations Management
ISBN:
9781259666100
Author:
F. Robert Jacobs, Richard B Chase
Publisher:
McGraw-Hill Education


Purchasing and Supply Chain Management
Operations Management
ISBN:
9781285869681
Author:
Robert M. Monczka, Robert B. Handfield, Larry C. Giunipero, James L. Patterson
Publisher:
Cengage Learning

Production and Operations Analysis, Seventh Editi…
Operations Management
ISBN:
9781478623069
Author:
Steven Nahmias, Tava Lennon Olsen
Publisher:
Waveland Press, Inc.