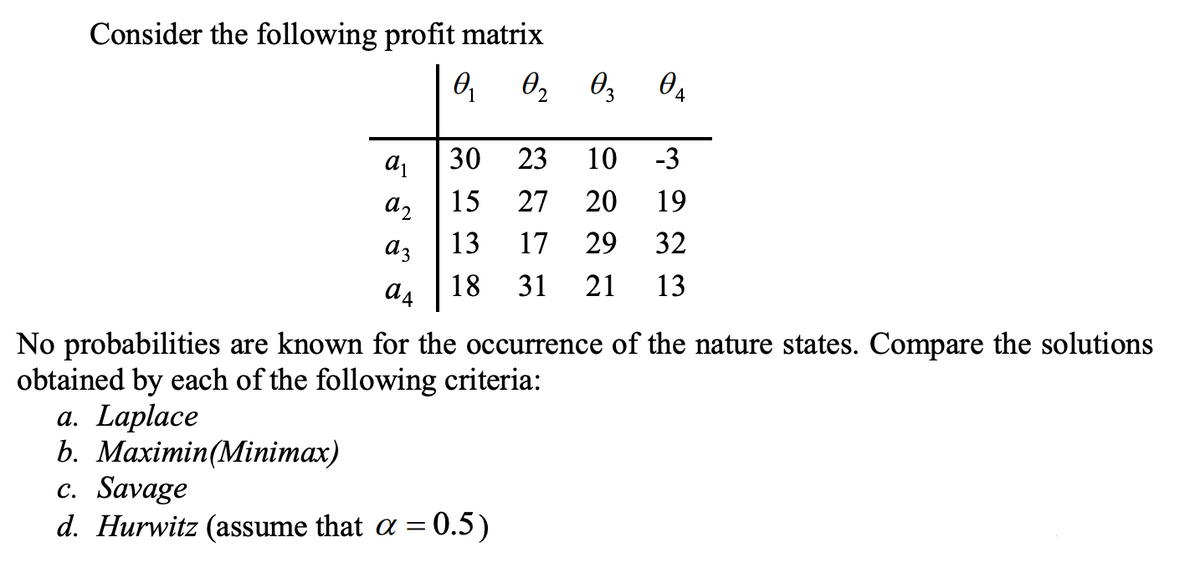
Consider the following profit matrix 30 23 10 -3 a2 15 27 20 19 13 17 29 32 az 18 a4 31 21 13 No probabilities are known for the occurrence of the nature states. Compare the solutions obtained by each of the following criteria: a. Laplace b. Махітіn(Minimax) c. Savage d. Hurwitz (assume that a = 0.5)


Q: The State of Nature Decision Alternative 0.83 1-0.83- S1 S2 D1 3 D2 7 D3 13 6. What is the Minimum…
A: Probability of S1 = 0.83 Probability of S2 = 1 - 0.83 = 0.17 From the above calculation, the…
Q: A relatively small privately owned coal-mining company has the sales results summarized below.…
A: Allowed depreciation : Minimum of depreciation and taxable amount. Below is the calculation table-
Q: Salalah Methanol company management is considering three competing investment Projects Option1:…
A: a) Payback period Declaration presentation cumulative cash flow Sohar
Q: W. L. Brown, a direct marketer of women’s clothing,must determine how many telephone operators…
A: The aforementioned question is answered as below:
Q: Dickie Hustler has $2 and is going to toss an unfair coin(probability .4 of heads) three times.…
A:
Q: Determine the optimal action based on the maximax criterion ii. Determine the optimal action based…
A: The investor who has certain amount of money to be invested, has assigned probability based on his…
Q: Assume the maximum demand for Super is 600,000 barrels. What is the optimal maximum profit?…
A: Given data is Fuel type Revenue Max Demand Regular $18.50 350,000 Super $20 600,000…
Q: Consider a monopolistically competitive market with NN firms. Each firm's business opportunities are…
A: given,
Q: Build a linear programming model to develop an investment portfolio that minimizes total risk under…
A: NOTE: WE ARE ONLY ALLOWED TO DO THE FIRST THREE SUB-PARTS AT A TIME. PLEASE POST THE REST QUESTIONS…
Q: Q2. What is the optimal solution and what is the value of the objective function? Show the relevant…
A: Q2.To find the objective function value Let us define the objective function and decision variables…
Q: For the Orlando real estate investment problem, assume the probabilities for the gasoline shortage,…
A: Given data is
Q: 1) When chef Paolo prices his speciality ‘pizza-n-all’ meal at £25, he sells 20 meals a day. When…
A: Given that - Price of ‘pizza-n-all’ meal = £25 Selling Quantity = 20 Total revenue = Price x…
Q: Brandon is considering expansion of a store. If he expands, the interest rate at which he borrows…
A: The decision tree has been represented as shown in the diagram.
Q: 2. An analyst determines the intrinsic value of a stock to be equal to 255 lei. If the stock's…
A: The correct option is A) Overvalued Overview: To estimate a portfolio' intrinsic worth, portfolio…
Q: Jane's marginal benefit per day from drinking coke is given in the table below. This shows that she…
A: Marginal benefit refers to the maximum amount of income an individual is willing to spend for an…
Q: Home price y is estimated as a function of the square footage of a house x and a dummy variable d…
A: Given: y = 118.90 +0.12x + 52.60d i.) For a house with mountain views, d = 1 For a house with…
Q: A company operates under hard budget constraints and has a WACC of 12%. In the current year it can…
A: Below is the solution:-
Q: Drawthe budget constraint for a consumer with standard preferences.
A: For the First Part here is the solution: If the consumer had an income of $3,000 and the cost of…
Q: Suppose a grocer is faced with a problem of how many cases of milk to stock to meet this week’s…
A: Cost Price = $55 Selling Price = $90 Salvage value = $30
Q: a) If he wants to maximize his profit, how many dozens of each kind should he bake if his profit for…
A: Since you have posted a question with multiple sub-parts, we will solve the first three subparts for…
Q: Suppose that a decision is faced with three decision alternatives and four states of nature. The…
A: Following is the computed table: Formulas used: Decision: A3 will be recommended.
Q: Compute the expected opportunity loss (EOL) for each investment v. Explain the meaning of the…
A: Expected Monitory value indicating a decision making tool where the future remains as uncertain.…
Q: c. From the following decision tree, develop a payoff table and calculate: * Maximax, Minimax…
A: The value for each of the payoffs and criteria are calculated in excel with the formulas shown in…
Q: A simple desicion-making model with maximalization criteria is given. State 1 State 2 State 3…
A: Decision making under uncertainty involves maximax criteria which are also known as an optimistic…
Q: Cox Electric makes electronic components and has estimated the following for a new design of one of…
A: Find the Given details below: Given Details: Fixed Cost 12750 $ Material Cost 0.16 $/Unit…
Q: Geoff Gullo owns a small firm that manufactures “Gullo Sunglasses.” He has the opportunity to sell a…
A: Answer-a with alternative 1 the land end deal cost is $100, buy cost is $65 and salvege valu is $53…
Q: 2. A daily demand for loaves of bread at a grocery store is given by the fllowing probability…
A: Given data is
Q: a.) Draw a decision tree. b.) Determine the expected payoff for each decision and event node. c.)…
A: A Small Introduction about Demand Market interest structure the most essential ideas of financial…
Q: Select the best statement if we consider the following situation: The right-hand side of a…
A: Given - Shadow price = 1.2 Allowable increase = 15 Allowable decrease =10Constraint R.H.S = 30
Q: Miller-Orr model to manage its cash investment. Seminole’s management has determined that the cost…
A: The question is related to the Miller-Orr model of Cash management. This approach allows lower and…
Q: Based on the following sensitivity analysis, which of the following products would be considered…
A: Using the sensitivity report:
Q: The produce manager at the local Pig & Whistle grocery store must determine how many pounds of…
A: The Expected Monetary Value concept is taken for decision analysis. For each option, the pay-off are…
Q: A manager must make a decision on shipping. There are two shippers, A and B. Both offer a twoday…
A:
Q: The CrystalTip Company has a production plan. The company wants to determine which of their premium…
A: “Since you have posted a question with multiple sub-parts, we will solve first three sub-parts for…
Q: Hemmingway, Inc., is considering a $5 million research and development (R&D) project. Profit…
A: Determine the expected value of the strategy as shown below: Calculate the expected value for node…
Q: An investor has a certain amount of money available to invest now. Three alternative investments are…
A: Decision analysis are often defined because the approach utilized in business operations to form the…
Q: A company has production costs of $15 per item and can produce 270 items for a total cost of $6,925.…
A: Slope intercept form = ax + b where x = slope b = intercept Given: Cost to make 270 units…
Q: Based on the following sensitivity analysis, which of the following products would be considered…
A: Given sensitivity report : There are allowable ranges given corresponding to each variable.…
Q: The Acme Company is developing a product, the fixed costs are estimated to be $6000. and the unit…
A:
Q: In the time interval between t and t 1 seconds beforethe departure of Braneast Airlines Flight 313,…
A: The capacity of Flight is 100 passengers Duration is (t tp t-1) seconds the reservation probability…
Q: A company operates under hard budget constraints and has a WACC of 12%. In the current year it can…
A: THE ANSWER IS AS BELOW:
Q: Steve Johnson believes that this winter is going to be extremely rainy, and he is trying to decide…
A: Please find the attached excel working in below step-
Q: Based on the following sensitivity analysis, which of the following products would be considered…
A:
Q: A consumer has income of £3,000. Apple juice is priced at £3 a bottle and cheese is priced at £6 a…
A: Disclaimer: Since you have asked multiple question, so we will solve the first question for you. If…
Q: An investor has a certain amount of money available to invest now. Three alternative investments are…
A: Hello thank you for the question. As per guidelines, we would provide only first three sub-parts at…
Q: The daily demand for a product in a shop can assume one of the following values: 100, 120, or 130…
A: The optimal stock assigns the specific measure of stock a business needs to satisfy routine interest…

Step by step
Solved in 4 steps with 5 images

- In Example 11.1, the possible profits vary from negative to positive for each of the 10 possible bids examined. a. For each of these, use @RISKs RISKTARGET function to find the probability that Millers profit is positive. Do you believe these results should have any bearing on Millers choice of bid? b. Use @RISKs RISKPERCENTILE function to find the 10th percentile for each of these bids. Can you explain why the percentiles have the values you obtain?Based on Grossman and Hart (1983). A salesperson for Fuller Brush has three options: (1) quit, (2) put forth a low level of effort, or (3) put forth a high level of effort. Suppose for simplicity that each salesperson will sell 0, 5000, or 50,000 worth of brushes. The probability of each sales amount depends on the effort level as described in the file P07_71.xlsx. If a salesperson is paid w dollars, he or she regards this as a benefit of w1/2 units. In addition, low effort costs the salesperson 0 benefit units, whereas high effort costs 50 benefit units. If a salesperson were to quit Fuller and work elsewhere, he or she could earn a benefit of 20 units. Fuller wants all salespeople to put forth a high level of effort. The question is how to minimize the cost of encouraging them to do so. The company cannot observe the level of effort put forth by a salesperson, but it can observe the size of his or her sales. Thus, the wage paid to the salesperson is completely determined by the size of the sale. This means that Fuller must determine w0, the wage paid for sales of 0; w5000, the wage paid for sales of 5000; and w50,000, the wage paid for sales of 50,000. These wages must be set so that the salespeople value the expected benefit from high effort more than quitting and more than low effort. Determine how to minimize the expected cost of ensuring that all salespeople put forth high effort. (This problem is an example of agency theory.)Referring to Example 11.1, if the average bid for each competitor stays the same, but their bids exhibit less variability, does Millers optimal bid increase or decrease? To study this question, assume that each competitors bid, expressed as a multiple of Millers cost to complete the project, follows each of the following distributions. a. Triangular with parameters 1.0, 1.3, and 2.4 b. Triangular with parameters 1.2, 1.3, and 2.2 c. Use @RISKs Define Distributions window to check that the distributions in parts a and b have the same mean as the original triangular distribution in the example, but smaller standard deviations. What is the common mean? Why is it not the same as the most likely value, 1.3?
- If a monopolist produces q units, she can charge 400 4q dollars per unit. The variable cost is 60 per unit. a. How can the monopolist maximize her profit? b. If the monopolist must pay a sales tax of 5% of the selling price per unit, will she increase or decrease production (relative to the situation with no sales tax)? c. Continuing part b, use SolverTable to see how a change in the sales tax affects the optimal solution. Let the sales tax vary from 0% to 8% in increments of 0.5%.A European put option allows an investor to sell a share of stock at the exercise price on the exercise data. For example, if the exercise price is 48, and the stock price is 45 on the exercise date, the investor can sell the stock for 48 and then immediately buy it back (that is, cover his position) for 45, making 3 profit. But if the stock price on the exercise date is greater than the exercise price, the option is worthless at that date. So for a put, the investor is hoping that the price of the stock decreases. Using the same parameters as in Example 11.7, find a fair price for a European put option. (Note: As discussed in the text, an actual put option is usually for 100 shares.)Suppose you currently have a portfolio of three stocks, A, B, and C. You own 500 shares of A, 300 of B, and 1000 of C. The current share prices are 42.76, 81.33, and, 58.22, respectively. You plan to hold this portfolio for at least a year. During the coming year, economists have predicted that the national economy will be awful, stable, or great with probabilities 0.2, 0.5, and 0.3. Given the state of the economy, the returns (one-year percentage changes) of the three stocks are independent and normally distributed. However, the means and standard deviations of these returns depend on the state of the economy, as indicated in the file P11_23.xlsx. a. Use @RISK to simulate the value of the portfolio and the portfolio return in the next year. How likely is it that you will have a negative return? How likely is it that you will have a return of at least 25%? b. Suppose you had a crystal ball where you could predict the state of the economy with certainty. The stock returns would still be uncertain, but you would know whether your means and standard deviations come from row 6, 7, or 8 of the P11_23.xlsx file. If you learn, with certainty, that the economy is going to be great in the next year, run the appropriate simulation to answer the same questions as in part a. Repeat this if you learn that the economy is going to be awful. How do these results compare with those in part a?
- In Problem 11 from the previous section, we stated that the damage amount is normally distributed. Suppose instead that the damage amount is triangularly distributed with parameters 500, 1500, and 7000. That is, the damage in an accident can be as low as 500 or as high as 7000, the most likely value is 1500, and there is definite skewness to the right. (It turns out, as you can verify in @RISK, that the mean of this distribution is 3000, the same as in Problem 11.) Use @RISK to simulate the amount you pay for damage. Run 5000 iterations. Then answer the following questions. In each case, explain how the indicated event would occur. a. What is the probability that you pay a positive amount but less than 750? b. What is the probability that you pay more than 600? c. What is the probability that you pay exactly 1000 (the deductible)?An automobile manufacturer is considering whether to introduce a new model called the Racer. The profitability of the Racer depends on the following factors: The fixed cost of developing the Racer is triangularly distributed with parameters 3, 4, and 5, all in billions. Year 1 sales are normally distributed with mean 200,000 and standard deviation 50,000. Year 2 sales are normally distributed with mean equal to actual year 1 sales and standard deviation 50,000. Year 3 sales are normally distributed with mean equal to actual year 2 sales and standard deviation 50,000. The selling price in year 1 is 25,000. The year 2 selling price will be 1.05[year 1 price + 50 (% diff1)] where % diff1 is the number of percentage points by which actual year 1 sales differ from expected year 1 sales. The 1.05 factor accounts for inflation. For example, if the year 1 sales figure is 180,000, which is 10 percentage points below the expected year 1 sales, then the year 2 price will be 1.05[25,000 + 50( 10)] = 25,725. Similarly, the year 3 price will be 1.05[year 2 price + 50(% diff2)] where % diff2 is the percentage by which actual year 2 sales differ from expected year 2 sales. The variable cost in year 1 is triangularly distributed with parameters 10,000, 12,000, and 15,000, and it is assumed to increase by 5% each year. Your goal is to estimate the NPV of the new car during its first three years. Assume that the company is able to produce exactly as many cars as it can sell. Also, assume that cash flows are discounted at 10%. Simulate 1000 trials to estimate the mean and standard deviation of the NPV for the first three years of sales. Also, determine an interval such that you are 95% certain that the NPV of the Racer during its first three years of operation will be within this interval.Suppose you begin year 1 with 5000. At the beginning of each year, you put half of your money under a mattress and invest the other half in Whitewater stock. During each year, there is a 40% chance that the Whitewater stock will double, and there is a 60% chance that you will lose half of your investment. To illustrate, if the stock doubles during the first year, you will have 3750 under the mattress and 3750 invested in Whitewater during year 2. You want to estimate your annual return over a 30-year period. If you end with F dollars, your annual return is (F/5000)1/30 1. For example, if you end with 100,000, your annual return is 201/30 1 = 0.105, or 10.5%. Run 1000 replications of an appropriate simulation. Based on the results, you can be 95% certain that your annual return will be between which two values?
- Although the normal distribution is a reasonable input distribution in many situations, it does have two potential drawbacks: (1) it allows negative values, even though they may be extremely improbable, and (2) it is a symmetric distribution. Many situations are modelled better with a distribution that allows only positive values and is skewed to the right. Two of these that have been used in many real applications are the gamma and lognormal distributions. @RISK enables you to generate observations from each of these distributions. The @RISK function for the gamma distribution is RISKGAMMA, and it takes two arguments, as in =RISKGAMMA(3,10). The first argument, which must be positive, determines the shape. The smaller it is, the more skewed the distribution is to the right; the larger it is, the more symmetric the distribution is. The second argument determines the scale, in the sense that the product of it and the first argument equals the mean of the distribution. (The mean in this example is 30.) Also, the product of the second argument and the square root of the first argument is the standard deviation of the distribution. (In this example, it is 3(10=17.32.) The @RISK function for the lognormal distribution is RISKLOGNORM. It has two arguments, as in =RISKLOGNORM(40,10). These arguments are the mean and standard deviation of the distribution. Rework Example 10.2 for the following demand distributions. Do the simulated outputs have any different qualitative properties with these skewed distributions than with the triangular distribution used in the example? a. Gamma distribution with parameters 2 and 85 b. Gamma distribution with parameters 5 and 35 c. Lognormal distribution with mean 170 and standard deviation 60Based on Babich (1992). Suppose that each week each of 300 families buys a gallon of orange juice from company A, B, or C. Let pA denote the probability that a gallon produced by company A is of unsatisfactory quality, and define pB and pC similarly for companies B and C. If the last gallon of juice purchased by a family is satisfactory, the next week they will purchase a gallon of juice from the same company. If the last gallon of juice purchased by a family is not satisfactory, the family will purchase a gallon from a competitor. Consider a week in which A families have purchased juice A, B families have purchased juice B, and C families have purchased juice C. Assume that families that switch brands during a period are allocated to the remaining brands in a manner that is proportional to the current market shares of the other brands. For example, if a customer switches from brand A, there is probability B/(B + C) that he will switch to brand B and probability C/(B + C) that he will switch to brand C. Suppose that the market is currently divided equally: 10,000 families for each of the three brands. a. After a year, what will the market share for each firm be? Assume pA = 0.10, pB = 0.15, and pC = 0.20. (Hint: You will need to use the RISKBINOMLAL function to see how many people switch from A and then use the RISKBENOMIAL function again to see how many switch from A to B and from A to C. However, if your model requires more RISKBINOMIAL functions than the number allowed in the academic version of @RISK, remember that you can instead use the BENOM.INV (or the old CRITBENOM) function to generate binomially distributed random numbers. This takes the form =BINOM.INV (ntrials, psuccess, RAND()).) b. Suppose a 1% increase in market share is worth 10,000 per week to company A. Company A believes that for a cost of 1 million per year it can cut the percentage of unsatisfactory juice cartons in half. Is this worthwhile? (Use the same values of pA, pB, and pC as in part a.)The IRR is the discount rate r that makes a project have an NPV of 0. You can find IRR in Excel with the built-in IRR function, using the syntax =IRR(range of cash flows). However, it can be tricky. In fact, if the IRR is not near 10%, this function might not find an answer, and you would get an error message. Then you must try the syntax =IRR(range of cash flows, guess), where guess" is your best guess for the IRR. It is best to try a range of guesses (say, 90% to 100%). Find the IRR of the project described in Problem 34. 34. Consider a project with the following cash flows: year 1, 400; year 2, 200; year 3, 600; year 4, 900; year 5, 1000; year 6, 250; year 7, 230. Assume a discount rate of 15% per year. a. Find the projects NPV if cash flows occur at the ends of the respective years. b. Find the projects NPV if cash flows occur at the beginnings of the respective years. c. Find the projects NPV if cash flows occur at the middles of the respective years.