Consider a linear demand model to explain the quantity demanded for a product: Q = a + B, Pr ice + B, Income + B, Advert + ɛ where Q quantity sold, Price = price of the product, Income = purchaser's income, Advert = %3D advertising. The following data was collected in year 2018. The company spends millions of money in advertisements. The company wants to know how advertisement as well how other factors affect the quantity of units sold. The results are as follows: Model Summary R 0.986 R2 0.973 Standard error of estimate 6.9872 Variables Coefficient Std error Sig Constant 205.862 19.354 0.000 Price -12.242 1.407 0.000 Income 1.414 0.422 0.015 Advert -3,344 1.798 0.112 Interpret and write a report based on the results obtained above.
Consider a linear demand model to explain the quantity demanded for a product: Q = a + B, Pr ice + B, Income + B, Advert + ɛ where Q quantity sold, Price = price of the product, Income = purchaser's income, Advert = %3D advertising. The following data was collected in year 2018. The company spends millions of money in advertisements. The company wants to know how advertisement as well how other factors affect the quantity of units sold. The results are as follows: Model Summary R 0.986 R2 0.973 Standard error of estimate 6.9872 Variables Coefficient Std error Sig Constant 205.862 19.354 0.000 Price -12.242 1.407 0.000 Income 1.414 0.422 0.015 Advert -3,344 1.798 0.112 Interpret and write a report based on the results obtained above.

MATLAB: An Introduction with Applications
6th Edition
ISBN:9781119256830
Author:Amos Gilat
Publisher:Amos Gilat
Chapter1: Starting With Matlab
Section: Chapter Questions
Problem 1P

Related questions

Concept explainers
Equations and Inequations
Equations and inequalities describe the relationship between two mathematical expressions.
Linear Functions
A linear function can just be a constant, or it can be the constant multiplied with the variable like x or y. If the variables are of the form, x2, x1/2 or y2 it is not linear. The exponent over the variables should always be 1.
Question
How to solve this sir??
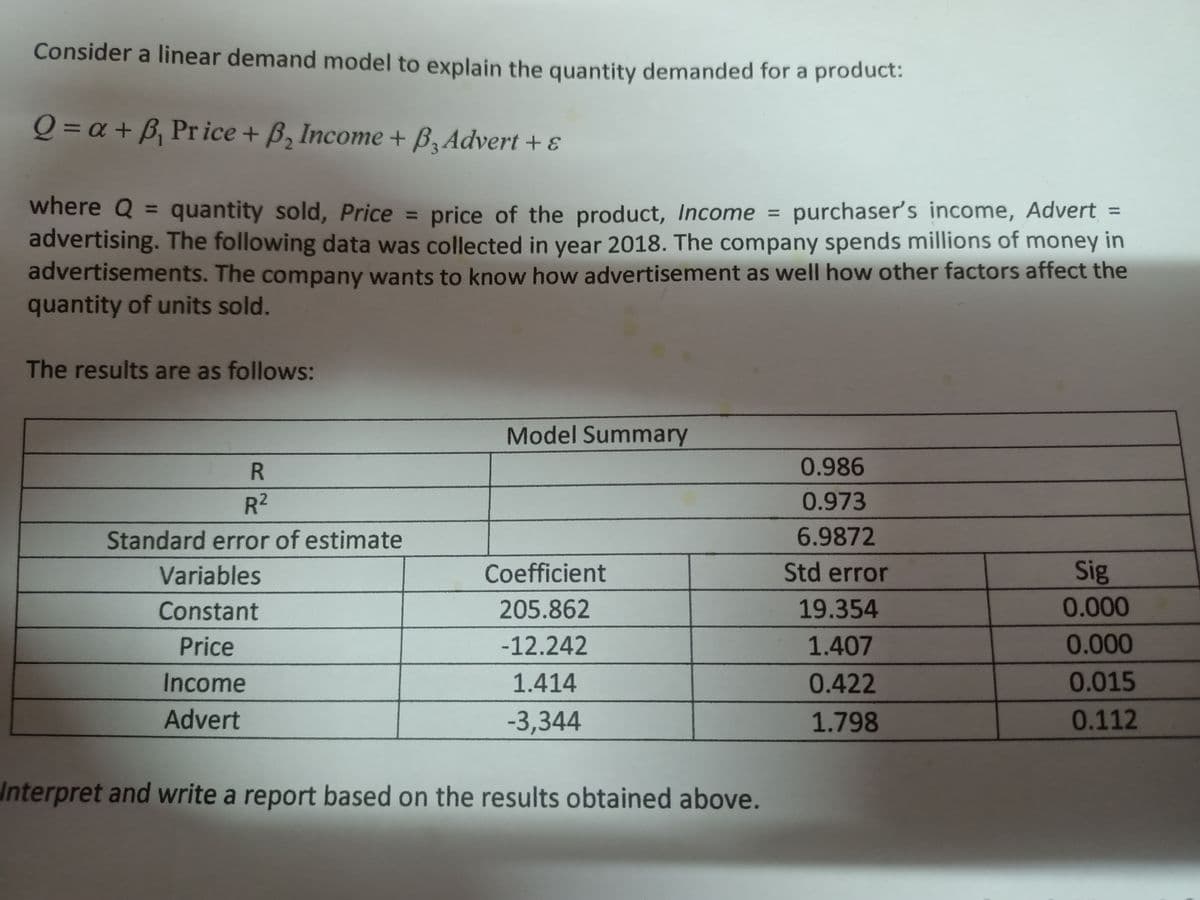
Transcribed Image Text:Consider a linear demand model to explain the quantity demanded for a product:
Q = a + B, Pr ice + B, Income + BzAdvert + ɛ
where Q = quantity sold, Price = price of the product, Income = purchaser's income, Advert =
advertising. The following data was collected in year 2018. The company spends millions of money in
advertisements. The company wants to know how advertisement as well how other factors affect the
quantity of units sold.
%3D
%3D
%3D
The results are as follows:
Model Summary
0.986
R.
R2
0.973
Standard error of estimate
6.9872
Variables
Coefficient
Std error
Sig
Constant
205.862
19.354
0.000
Price
-12.242
1.407
0.000
Income
1.414
0.422
0.015
Advert
-3,344
1.798
0.112
Interpret and write a report based on the results obtained above.
Expert Solution
This question has been solved!
Explore an expertly crafted, step-by-step solution for a thorough understanding of key concepts.

Step by step
Solved in 2 steps

Knowledge Booster


Learn more about
Need a deep-dive on the concept behind this application? Look no further. Learn more about this topic, statistics and related others by exploring similar questions and additional content below.Recommended textbooks for you
MATLAB: An Introduction with Applications
Statistics
ISBN:
9781119256830
Author:
Amos Gilat
Publisher:
John Wiley & Sons Inc

Probability and Statistics for Engineering and th…
Statistics
ISBN:
9781305251809
Author:
Jay L. Devore
Publisher:
Cengage Learning

Statistics for The Behavioral Sciences (MindTap C…
Statistics
ISBN:
9781305504912
Author:
Frederick J Gravetter, Larry B. Wallnau
Publisher:
Cengage Learning
MATLAB: An Introduction with Applications
Statistics
ISBN:
9781119256830
Author:
Amos Gilat
Publisher:
John Wiley & Sons Inc
Probability and Statistics for Engineering and th…
Statistics
ISBN:
9781305251809
Author:
Jay L. Devore
Publisher:
Cengage Learning
Statistics for The Behavioral Sciences (MindTap C…
Statistics
ISBN:
9781305504912
Author:
Frederick J Gravetter, Larry B. Wallnau
Publisher:
Cengage Learning

Elementary Statistics: Picturing the World (7th E…
Statistics
ISBN:
9780134683416
Author:
Ron Larson, Betsy Farber
Publisher:
PEARSON

The Basic Practice of Statistics
Statistics
ISBN:
9781319042578
Author:
David S. Moore, William I. Notz, Michael A. Fligner
Publisher:
W. H. Freeman

Introduction to the Practice of Statistics
Statistics
ISBN:
9781319013387
Author:
David S. Moore, George P. McCabe, Bruce A. Craig
Publisher:
W. H. Freeman