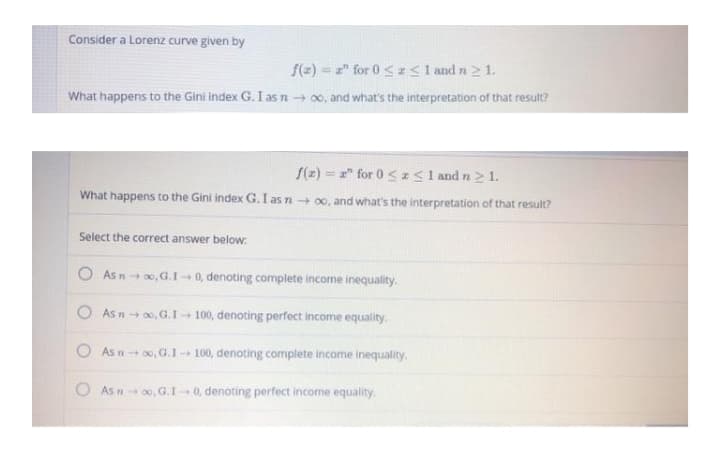
Consider a Lorenz curve given by f(=) = z" for 0< z< 1 and n 2 1. %3D What happens to the Gini index G. I as n+ 00, and what's the interpretation of that result? S(z) = z" for 0


Q: IM R %24 How does progressive taxation and redistribution policies affect the Lorenz curve and Gini…
A: Gini coefficient is a numeric measures of income inequality and Lorenze curve is the graph that…
Q: A typical Lorenz Curve, extracted from the Textbook, is shown below: 100 80 Lorenz curve (actual…
A: The Lorenz curve is simply the graphical representation of income inequalities. The line of…
Q: Why is the Lorenz curve curvilinear? How is the curve currently changing?
A: Lorenz curve is a diagrammatical way to measure income inequality. It is used in economic research…
Q: Suppose that a society contains only two members, a lawyer named Monique and a handyman named James.…
A: A society contains only two members, a lawyer named Monique and a handyman named James. Monique made…
Q: 3. Thailand's Gini index in 2019 was 34.9%. The equation of the Lorenz curve that was used to…
A: Gini index is a measure to calculate income inequality in a country. It is equal to the ratio of…
Q: When the Lorenz curve lies above thediagonal,a. the poorest 20 percent of the populationreceive more…
A: Lorenz curve is the curve which shows inequality in the economy, it could be income inequality or…
Q: Which one of the following is the most likely to be associated with an increase in the incidence of…
A:
Q: 1. Consider an economy of ten people and two sectors (traditional and modern) with yearly incomes…
A:
Q: Which of the following is true with respect the distribution of income in Ukraine, based on the…
A: Lorenz curve and Ginni coefficient are the tools used to measure the inequality in an economy. With…
Q: Suppose a Lorenz curve for a particular country is f(x)=x^2for 0≤x≤1. What is the Gini index of…
A: Gini index (GI) can be calculated by using the following formula.
Q: Refer to the figure given below. A Lorenz Curve On the Lorenz curve shown in the diagram, 100- O A.…
A: Lorenz curve is a measure of inequality in the economy. Cumulative percentage of families is taken…
Q: As income transfer programs accompanying the War on Poverty increased beginning in the latter half…
A: Income move programs point towards reallocation and moving of abundance and income through the…
Q: You have been provided with the following statement: “According to the World Bank, South Africa…
A: Ginni coefficient shows the level of inequality in any country. Higher value of ginni means higher…
Q: Q. 4. The economy of Zenda has 10 people. Three of them modern sector of Zenda and eari traditional…
A: ii)The Gini coefficient (also known as the Gini index or Gins ratio) is a statistical dispersion…
Q: After regressive transfer, what proportion of total income belongs to bottom 80 percent of the…
A: Introduction: Gini Coefficient: The Gini index, often known as the Gini coefficient, is a measure of…
Q: Explain the Lorenz Curve.
A: A Lorenz curve may be a graphical representation of income inequality or wealth inequality developed…
Q: Based on a study, the Lorenz curves for the distribution of incomes for bankers and actuaries are…
A: Given information Lorenz Curve function for Bankers: f(x)=110x+910x2 Lorenz Curve function for…
Q: Answer in complete solutions: The government of a small country is planning sweeping changes in the…
A: We are going to find the Gini coefficient with respect to two different Lorenz curve to answer this…
Q: Suppose the government implements a negative income tax plan to deal with the poverty problem. The…
A: Negative income tax is given to every American without income above the threshold value of income.
Q: Using the Lorenz Curve, answer the following questions. . . Approximately what percentage of the…
A: A Lorenz curve shows the spread of distribution. It is used to show inequality of distribution. The…
Q: ITEM No.4 Draw the Lorenz curve and compute the Gini index of a group whose annual incomes (in…
A: Gini coefficient is a statistical tool to measure income inequality within a nation. Its value…
Q: ) If a Lorenz curve is differentiable, the slope of the Lorenz curve can be used to analyse income…
A: A Lorenz curve is a graphical representation of a community's income or wealth distribution.Lorenz…
Q: Below is a Lorenz Curve for a given country. Suppose its government establishes a 10% income tax on…
A: A Lorenz curve is a graphical representation of a community's income or wealth distribution.Lorenz…
Q: Describe what has happened to the value of the Gini Coefficient since 1980? What is the implication…
A: The Lorenz curve is a representation of the distribution of a metric – consumption, wages,…
Q: By finding the ___________, Gini Coefficient is determined/calculated. a. difference between the…
A: The correct answer is given in the second step.
Q: 2. Draw a complete and clearly labeled Lorenz Curve using the information below.
A: Lorenz Curve is defined as a curve which graphically represents the distribution of wealth or income…
Q: 100 80- Country X 40 20- Country Z 20 40 60 80 100 PERCENTAGE OF HOUSEHOLDS 4. Based on the…
A:
Q: 4. An economist produced the following Lorenz curves for the current income distributio and the…
A: *Answer:
Q: Assume that workers whoses are less than $8000 currently pay no federal income taxes. Suppose a new…
A: Initially, first, $8,000 was untaxed. so we don't know the tax rate so assumed at 0 to make it…
Q: The total income generated from all activities b. The degree of inequality in the distribution of…
A: Lorenze curve is the graph that showing percentage of country's income that is earn by a given…
Q: Suppose that the Gini coefficient for Niger is 0.23 and the Gini coefficient for Canada is 0.34.…
A: Poverty refers to a condition of people in which they are unable to afford even the basic…
Q: The table provides data on peprcentage of total income earned by quintile in two communities, Malaya…
A: Lorenz curve for Malaya:
Q: Cumulative 100% percentage of income - Niger 90% 80% ---Argentina 70% 60% 50% 40% 30% 20% 10% 0% 0%…
A: The straight diagonal line is the line of equality as it divides the box into two equal parts. So if…
Q: Canada had the following distribution of Income after taxes in 2006 Based on the information in the…
A: Gini Coefficient is a widely used measure for income inequality in the countries . Gini Coefficient…
Q: Would this transfer increase, decrease, or have no effect on income inequality in this group?…
A: Income: It refers to the money which people earn. The income is used by people to purchase things in…
Q: . Consider two communities. In one community,ten families have incomes of $100,000 each and…
A: Since you have posted a question with multiple sub-parts, we will solve first three subparts for…
Q: (e) Prove that in general every Lorenz curve lies below the Lorenz curve of the perfectly equal…
A: Lorenz curve is a graphical representation which is used to show how income or wealth is distributed…
Q: 4. An economist produced the following Lorenz curves for the current income distribution and the…
A: Lorenz curve is used to depict the distribution of income amongst the recipients in the form of a…
Q: Consider ten households, A through J, whose incomes are as shown below (first line). A C D E F G H.…
A: The distribution of income among the different sections of the population varies in most countries.…
Q: A Lorenz curve is a graphical representation of wealth distribution among a population. Conduct…
A: A Lorenz curve is a graphical representation of wealth distribution or income inequality among a…
Q: a. Is the presence of an underground economy likely to result in a Gini coefficient that overstates…
A: Gini coefficient is often being used as a gauge of economic inequality which measures the…
Q: True or False (and explain): When the Lorenz Curve is a straight diagonal line (at 45 degrees), we…
A:
Q: If an economy has perfect equality (everyone earns the same income), the Lorenz curve for that…
A: Lorenz curve:- A Lorenz curve is a graph the shows the allocation of money or wealth within a…
Q: Based on a study, the Lorenz curves for the distribution of incomes for bankers and actuaries are…
A: Introduction Lorenz function of bankers has given. Lorenz curve of functions f(x): f(x) = 110x + 910…

Step by step
Solved in 2 steps with 1 images


- Which set of policies is more likely to cause a tradeoff between economic output and equality: policies of redistribution policies aimed at the ladder of opportunity? Explain how the production possibility frontier tradeoff between economic equality and output might look in each case.. Consider two communities. In one community,ten families have incomes of $100,000 each and tenfamilies have incomes of $20,000 each. In the othercommunity, ten families have incomes of $250,000each and ten families have incomes of $25,000 each.a. In which community is the distribution of incomemore unequal? In which community is theproblem of poverty likely to be worse?b. Which distribution of income would Rawls prefer?Explain.c. Which distribution of income do you prefer?Explain.d. Why might someone have the oppositepreference?assume there are two types of workers, low- and high-ability, and let 0 = 0.25 be the proportion of high-ability workers in the population. Assume their marginal productivity and, therefore, their wages are wh = $20 and wl = $16, and that both types can use college education to signal high ability. The cost of college education for low-ability workers is cl = $5 whereas the cost for high-ability workers is ch = $2. How much do firms pay to each worker type when they cannot differentiate them? (a) wh = $20 and wl = $16 (b) wh = $2 and wl = $5 (c) w = $17 (d) w = $18
- No written by hand solution Consider a 100-person economy, where half of the population receives 20% of the total income and the other half the remaining 80%. Using the Lorenz-curve approximation, what is the Gini coefficient in this economy (please use the comma to seprare decimals, such as: x,y)?Lp = x^p for p is greater than or equal to 1 - Does a low Gini index correspond to an equitable or inequitable distribution of wealth? Explain. - for a general L(x), explain why G=2AAssume that the current Disability Insurance (DI) benefi t for those whoare unable to work is $X per day and that DI benefi ts go to zero if aworker accepts a job for even 1 hour per week. Suppose that the benefi trules are changed so those disabled workers who take jobs that pay lessthan $X per day receive a benefi t that brings their total daily income(earnings plus the DI benefi t) up to $X. As soon as their labor marketearnings rise above $X per day, their disability benefi ts end. Draw theold and new budget constraints (label each clearly) associated with theDI program, and analyze the work-incentive effects of the change inbenefi ts.
- assume there are two types of workers, low- and high-ability, andlet 0 = 0.25 be the proportion of high-ability workers in the population. Assume their marginalproductivity and, therefore, their wages are wh = $20 and wl = $16, and that both types canuse college education to signal high ability. The cost of college education for low-ability workersis cl = $5 whereas the cost for high-ability workers is ch = $2. Consider the wage for both types of workers and the high-ability workers’ college cost, ch. For which values of 0 (the proportion of high-ability workers in the population) do the high-ability workers prefer the separating equilibrium over the pooling equilibrium? (a) Any 0 > 1/2(b) Any 0 < 1/2 (c) Any 0 < 3/4(d) Only when 0 = 1No written by hand solution Suppose there are two sectors, call them A [agriculture] and M [manufacturing]. People earn say $5 an hour in agriculture and $10 an hour in manufacturing. Suppose we are interested in the share of the bottom 40% and the richest 20%. Let x be the share of people in manufacturing. Derive a formula that gives you the shares of income earned by the lowest 40% of the population and the richest 20% of the population as a function of x. This is a connection between structural transformation and the behavior of inequality.Here is one hypothesis: A well-funded social safety net can increase economic equality but will reduce economic output. Explain why this might be so, and sketch a production possibility curve that shows this tradeoff.
- Consider a large tract of land that is used for grazing sheep. Now consider two differentproperty ownership regimes: common property ownership, in which all shepherds haveunrestricted access to the land, and private property ownership, in which there is a singlelandowner who hires shepherds up until the point where their wage is equal to the marginalproduct of their labor. Show graphically how common property resource ownership can lead toovergrazing (too many shepherds using the same open-access rangeland) in the absence ofinstitutional constraints that would ensure an efficient level of resource usage. Contrast this withprivate property ownership. On your graph, label the axes, the average and marginal products oflabor, the wage, scarcity rents, the efficient number of shepherds, and the number that would beexpected under common property ownership. Explain the source of the inefficiency. Wouldprivatization be equitable? Would it be possible to achieve an efficient resource…This question is in the context of the Becker model. Suppose Firm A and Firm B sell their output in the same output market, purchase inputs in the same input markets and use the same production technology. Suppose the owners of Firm A and Firm B hire only women, with the following inequality true:WF(1 + dA) < WMandWF(1 + dB) < WM.If the discrimination coefficient is higher for Firm A than Firm B (dA > dB), then which of the following statements is true?●Firm B will earn higher profits●Both firms will earn the same profits●Firm A will earn higher profits●Both firms will earn less profit than they would if they had d=0Questions Explain three methods of measuring the income inequality of a nation? 1.kuznet ratio 2. Lorenz curve 3. Gini coefficient As in the case of income distribution, calculation of wealth distribution is done by different entities using different measurements, resulting in a disparity in outcomes. In fact, commonly, wealthis narrowly defined as financial wealth—namely, cash on handand the money value of tangible and nonliquid assets. Even justthe market valuation of financial portfolios is commonly used todefine financial wealth. However, some may extend the definitionto include the value of income streams and insurance rights that,for the most part, cannot be transacted or encumbered. Theseinclude Medicare, Medicaid, and Social Security. When suchtransfers and public assistance are included, the poor and manyelderly could benefit, reducing the wealth disparity (Galbraith2016). To obtain net wealth, the value of the debts are subtractedsubtracted from the value of the assets.…
