Consider a newspaper in a small town that has monopsony power in hiring journalists. The following table shows the labor hours that will be supplied at each of the given hourly wages, as well as the total cost of labor at each quantity of labor. Suppose the newspaper's demand for labor as a function MVP of the marginal value product of labor (MVPL) is given by L = 8- . Compute the marginal expense (MEL) and marginal value product (MVP) of adding an additional hour at each quantity and enter the values into the following table. Labor Supplled Total Labor Cost MEL MVPL Hourly Wage (Hours) (Dollars per hour) (Dollars per hour) (Dollars per hour) 3 6. 2. 12 9. 27 12 4. 48 15 75 The following graph depicts the supply of labor in this market. Use the grey polnts (star symbol) to plot the marginal expense at the five quantities of labor given in the previous table. Then use the blue points (circle symbol) to plot the firm's demand for labor as a function of the MVPL.
Consider a newspaper in a small town that has monopsony power in hiring journalists. The following table shows the labor hours that will be supplied at each of the given hourly wages, as well as the total cost of labor at each quantity of labor. Suppose the newspaper's demand for labor as a function MVP of the marginal value product of labor (MVPL) is given by L = 8- . Compute the marginal expense (MEL) and marginal value product (MVP) of adding an additional hour at each quantity and enter the values into the following table. Labor Supplled Total Labor Cost MEL MVPL Hourly Wage (Hours) (Dollars per hour) (Dollars per hour) (Dollars per hour) 3 6. 2. 12 9. 27 12 4. 48 15 75 The following graph depicts the supply of labor in this market. Use the grey polnts (star symbol) to plot the marginal expense at the five quantities of labor given in the previous table. Then use the blue points (circle symbol) to plot the firm's demand for labor as a function of the MVPL.

Chapter16: Labor Markets
Section: Chapter Questions
Problem 16.6P

Related questions
Question
Transcribed Image Text:30
27
Labor Supply
ME
24
21
Labor Demand
18
15
12
3.
2
8.
10
LABOR (Hours)
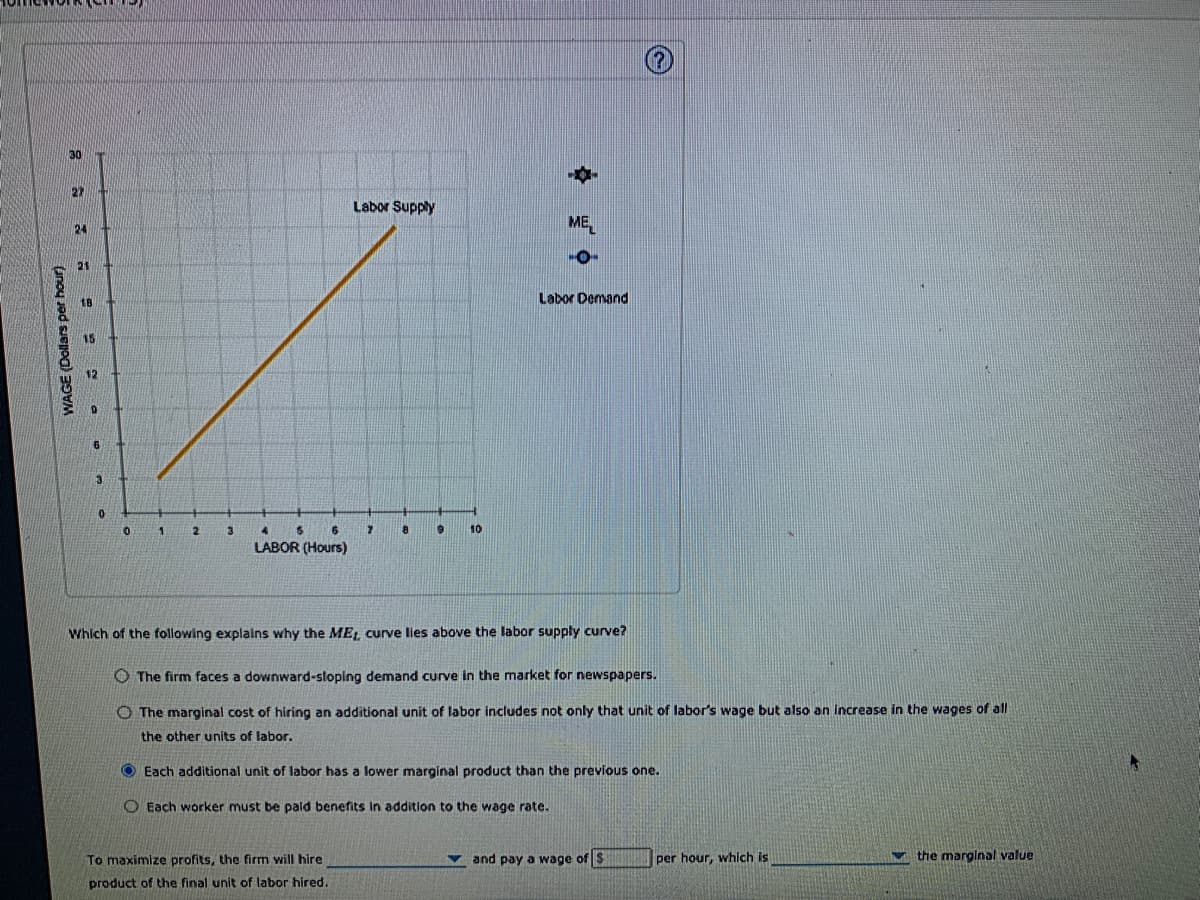
Which of the following explains why the ME, curve lles above the labor supply curve?
O The firm faces a downward-sloping demand curve in the market for newspapers.
O The marginal cost of hiring an additional unit of labor includes not only that unit of labor's wage but also an increase in the wages of all
the other units of labor.
O Each additional unit of labor has a lower marginal product than the previous one.
O Each worker must be paid benefits in addition to the wage rate.
To maximize profits, the firm will hire
v and pay a wage of $
per hour, which is
the marginal value
product of the final unit of labor hired.
WAGE (Dollars per hour)
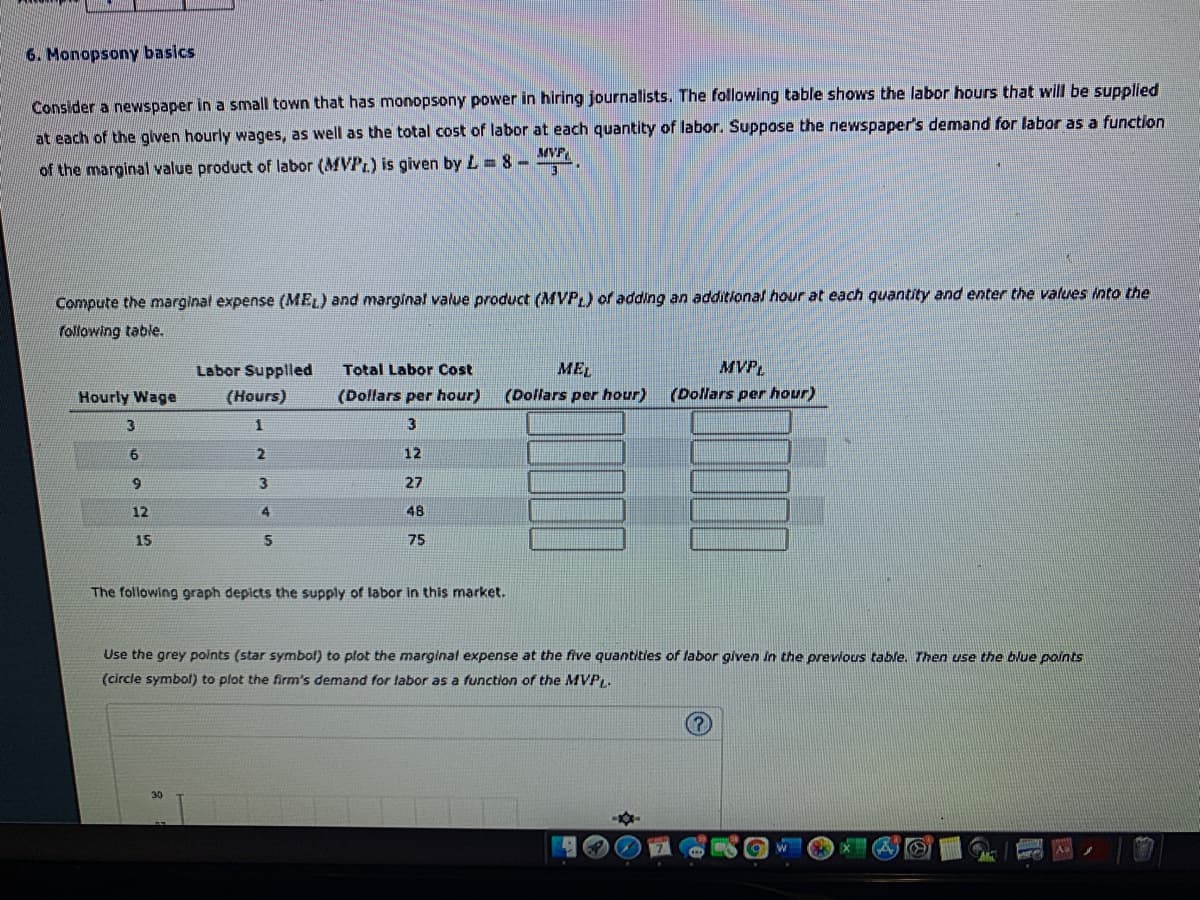
Transcribed Image Text:6. Monopsony basics
Consider a newspaper in a small town that has monopsony power in hiring journalists. The following table shows the labor hours that will be supplied
at each of the given hourly wages, as well as the total cost of labor at each quantity of labor. Suppose the newspaper's demand for labor as a function
of the marginal value product of labor (MVPL) is given by L= 8-
Compute the marginal expense (MEL) and marginal value product (MVP) of adding an additional hour at each quantity and enter the values into the
following table.
Labor Supplled
Total Labor Cost
MEL
MVP
Hourly Wage
(Hours)
(Dollars per hour)
(Dollars per hour)
(Dollars per hour)
3
3
6.
12
9
3
27
12
4
48
15
75
The following graph depicts the supply of labor in this market.
Use the grey points (star symbol) to plot the marginal expense at the five quantities of labor given in the prevlous table. Then use the blue points
(circle symbol) to plot the firm's demand for labor as a function of the MVPL.
Expert Solution
This question has been solved!
Explore an expertly crafted, step-by-step solution for a thorough understanding of key concepts.

This is a popular solution!

Trending now
This is a popular solution!

Step by step
Solved in 3 steps with 1 images

Recommended textbooks for you

Principles of Economics 2e
Economics
ISBN:
9781947172364
Author:
Steven A. Greenlaw; David Shapiro
Publisher:
OpenStax

Principles of Microeconomics
Economics
ISBN:
9781305156050
Author:
N. Gregory Mankiw
Publisher:
Cengage Learning
Principles of Economics 2e
Economics
ISBN:
9781947172364
Author:
Steven A. Greenlaw; David Shapiro
Publisher:
OpenStax
Principles of Microeconomics
Economics
ISBN:
9781305156050
Author:
N. Gregory Mankiw
Publisher:
Cengage Learning

Economics (MindTap Course List)
Economics
ISBN:
9781337617383
Author:
Roger A. Arnold
Publisher:
Cengage Learning


Principles of Economics, 7th Edition (MindTap Cou…
Economics
ISBN:
9781285165875
Author:
N. Gregory Mankiw
Publisher:
Cengage Learning