Economists who study production of goods by a firm consider two functions. The revenue function R(x) is the revenue the firm receives when a number of units are sold. The cost function C(x) is the cost the firm incurs when producing æ number of units. The derivatives of these functions R'(xæ) and C'(x) are called by economists the marginal revenue and cost function. The figure shows graphs of the marginal revenue function R' and the marginal cost function C' for a manufacturer. YA R'(x) 3 C'(x) 1 50 100 What does the shaded area in the figure represent? DA. The total revenue generated by the manufacturer. OB. The increase in profit as the production level increases from 50 to 100 units. OC. The total profit that the manufacturer earns. OD. The increase in revenue as the production level increases from 50 to 100 units. DE. The total cost generated by the manufacturer. F. The increase in cost as the production level increases from 50 to 100 units.
Economists who study production of goods by a firm consider two functions. The revenue function R(x) is the revenue the firm receives when a number of units are sold. The cost function C(x) is the cost the firm incurs when producing æ number of units. The derivatives of these functions R'(xæ) and C'(x) are called by economists the marginal revenue and cost function. The figure shows graphs of the marginal revenue function R' and the marginal cost function C' for a manufacturer. YA R'(x) 3 C'(x) 1 50 100 What does the shaded area in the figure represent? DA. The total revenue generated by the manufacturer. OB. The increase in profit as the production level increases from 50 to 100 units. OC. The total profit that the manufacturer earns. OD. The increase in revenue as the production level increases from 50 to 100 units. DE. The total cost generated by the manufacturer. F. The increase in cost as the production level increases from 50 to 100 units.

Managerial Economics: Applications, Strategies and Tactics (MindTap Course List)
14th Edition
ISBN:9781305506381
Author:James R. McGuigan, R. Charles Moyer, Frederick H.deB. Harris
Publisher:James R. McGuigan, R. Charles Moyer, Frederick H.deB. Harris
ChapterB: Differential Calculus Techniques In Management
Section: Chapter Questions
Problem 2E

Related questions

Question
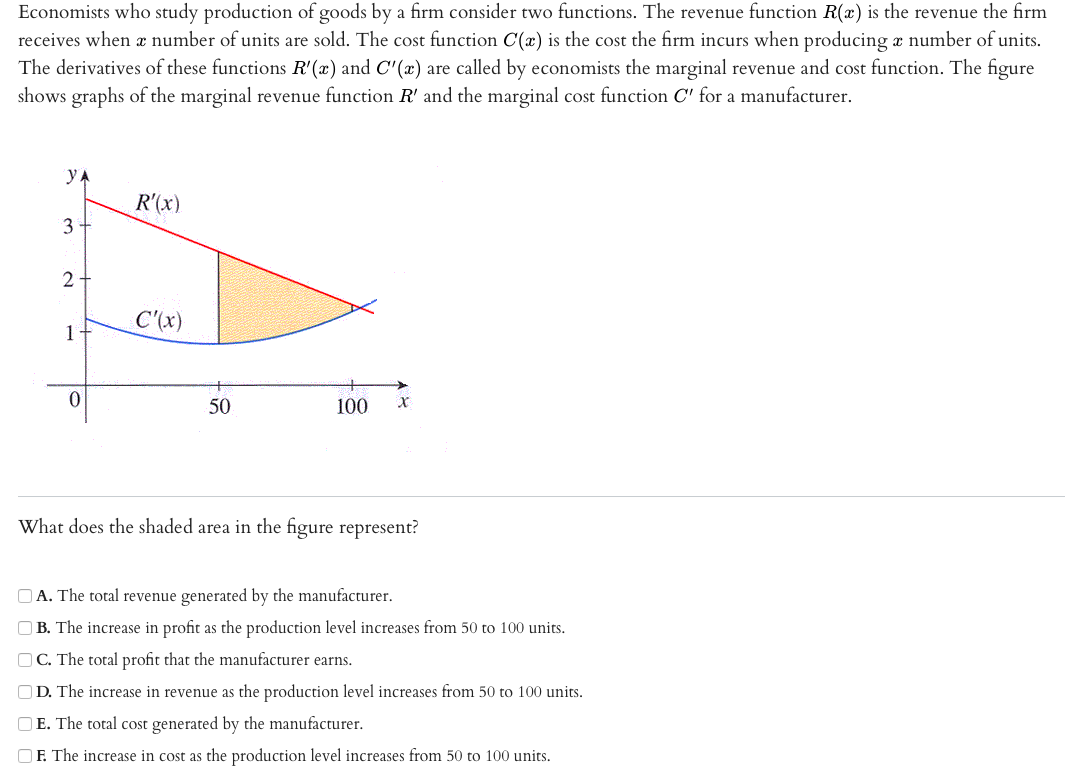
Transcribed Image Text:Economists who study production of goods by a firm consider two functions. The revenue function R(x) is the revenue the firm
receives when x number of units are sold. The cost function C(x) is the cost the firm incurs when producing x number of units.
The derivatives of these functions R'(x) and C'(æ) are called by economists the marginal revenue and cost function. The figure
shows graphs of the marginal revenue function R' and the marginal cost function C' for a manufacturer.
YA
R'(x)
3
C'(x)
1
50
100
What does the shaded area in the figure represent?
OA. The total revenue generated by the manufacturer.
OB. The increase in profit as the production level increases from 50 to 100 units.
OC. The total profit that the manufacturer earns.
OD. The increase in revenue as the production level increases from 50 to 100 units.
OE. The total cost generated by the manufacturer.
OF. The increase in cost as the production level increases from 50 to 100 units.
Expert Solution
This question has been solved!
Explore an expertly crafted, step-by-step solution for a thorough understanding of key concepts.

This is a popular solution!

Trending now
This is a popular solution!

Step by step
Solved in 3 steps

Knowledge Booster


Learn more about
Need a deep-dive on the concept behind this application? Look no further. Learn more about this topic, economics and related others by exploring similar questions and additional content below.Recommended textbooks for you
Managerial Economics: Applications, Strategies an…
Economics
ISBN:
9781305506381
Author:
James R. McGuigan, R. Charles Moyer, Frederick H.deB. Harris
Publisher:
Cengage Learning

Managerial Economics: Applications, Strategies an…
Economics
ISBN:
9781305506381
Author:
James R. McGuigan, R. Charles Moyer, Frederick H.deB. Harris
Publisher:
Cengage Learning