Consider a queueing system with two types of customers. Type 1 customers arrive according to a Poisson process with a mean rate of 7 per hour. Type 2 customers also arrive according to a Poisson process with a mean rate of 5 per hour. The system has two servers, both of which serve both types of customers. For both types, service times have an exponential distribution with a mean of 12 minutes. Service is provided on a first-come-first-served basis. a) What is the probability distribution (including its mean) of the time between consecutive arrival of customers of any type? b) When a particular type 2 customer arrives, he finds two type 1 customers there in the process of being served but no other customers in the system. What is the probability distribution (including its mean) of this type 2 customer's waiting time in the queue?
Consider a queueing system with two types of customers. Type 1 customers arrive according to a Poisson process with a mean rate of 7 per hour. Type 2 customers also arrive according to a Poisson process with a mean rate of 5 per hour. The system has two servers, both of which serve both types of customers. For both types, service times have an exponential distribution with a mean of 12 minutes. Service is provided on a first-come-first-served basis. a) What is the probability distribution (including its mean) of the time between consecutive arrival of customers of any type? b) When a particular type 2 customer arrives, he finds two type 1 customers there in the process of being served but no other customers in the system. What is the probability distribution (including its mean) of this type 2 customer's waiting time in the queue?

Linear Algebra: A Modern Introduction
4th Edition
ISBN:9781285463247
Author:David Poole
Publisher:David Poole
Chapter7: Distance And Approximation
Section7.3: Least Squares Approximation
Problem 31EQ

Related questions
Question
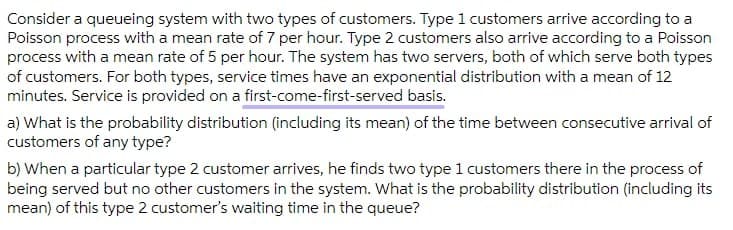
Transcribed Image Text:Consider a queueing system with two types of customers. Type 1 customers arrive according to a
Poisson process with a mean rate of 7 per hour. Type 2 customers also arrive according to a Poisson
process with a mean rate of 5 per hour. The system has two servers, both of which serve both types
of customers. For both types, service times have an exponential distribution with a mean of 12
minutes. Service is provided on a first-come-first-served basis.
a) What is the probability distribution (including its mean) of the time between consecutive arrival of
customers of any type?
b) When a particular type 2 customer arrives, he finds two type 1 customers there in the process of
being served but no other customers in the system. What is the probability distribution (including its
mean) of this type 2 customer's waiting time in the queue?
Expert Solution
This question has been solved!
Explore an expertly crafted, step-by-step solution for a thorough understanding of key concepts.

This is a popular solution!

Trending now
This is a popular solution!

Step by step
Solved in 3 steps

Recommended textbooks for you
Linear Algebra: A Modern Introduction
Algebra
ISBN:
9781285463247
Author:
David Poole
Publisher:
Cengage Learning
Linear Algebra: A Modern Introduction
Algebra
ISBN:
9781285463247
Author:
David Poole
Publisher:
Cengage Learning