Consider al of the coins (pennies, nickels, quarters, etc) n your pocket or purse as a pop- vation. Make a frequency table beginning with the curent year and counting backward to record the ages (n years) of the coins. For example, the curent yearis 20, hen a coln with 2003 stamped on it is 2years old. a. Drav a histogram or cther graph showhng the populetion dsribution. b. Randomly select fve colns and record the mean age of the sampled coirs. Repeat this sampling process 20 times. Now draw a istogram or other graph showing the distrbu- fion of the sample means. C. Compare the shapes of the two histograms.
Consider al of the coins (pennies, nickels, quarters, etc) n your pocket or purse as a pop- vation. Make a frequency table beginning with the curent year and counting backward to record the ages (n years) of the coins. For example, the curent yearis 20, hen a coln with 2003 stamped on it is 2years old. a. Drav a histogram or cther graph showhng the populetion dsribution. b. Randomly select fve colns and record the mean age of the sampled coirs. Repeat this sampling process 20 times. Now draw a istogram or other graph showing the distrbu- fion of the sample means. C. Compare the shapes of the two histograms.

Glencoe Algebra 1, Student Edition, 9780079039897, 0079039898, 2018
18th Edition
ISBN:9780079039897
Author:Carter
Publisher:Carter
Chapter10: Statistics
Section10.6: Summarizing Categorical Data
Problem 2GP

Related questions
Question
4
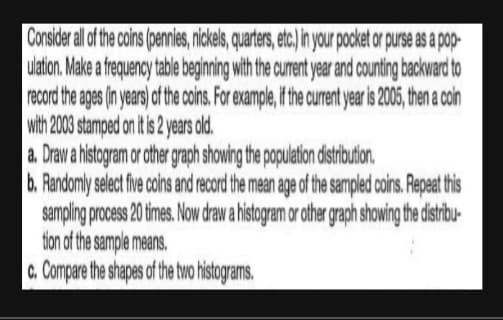
Transcribed Image Text:Consider all f the coins (pennles, nickels, quarters, etc.) n your pocket or purse as a pop-
ulation. Make a frequency table beginning with the curent year and counting backward to
record the ages (n years) f he coins. For example, it the curent year is 2005, then a coin
with 2003 stamped on it is years old.
a. Draw a histogram or other graph showing the population distrbution.
b. Randomly select five colns and record the mean age of the sampled coins. Repeat this
Sampling process 20 times. Now draw a histogram or other graph showing the distrbu-
tion of the sample means.
c. Compare the shapes of the two histograms.
Expert Solution
This question has been solved!
Explore an expertly crafted, step-by-step solution for a thorough understanding of key concepts.

This is a popular solution!

Trending now
This is a popular solution!

Step by step
Solved in 4 steps with 8 images

Recommended textbooks for you
Glencoe Algebra 1, Student Edition, 9780079039897…
Algebra
ISBN:
9780079039897
Author:
Carter
Publisher:
McGraw Hill

Holt Mcdougal Larson Pre-algebra: Student Edition…
Algebra
ISBN:
9780547587776
Author:
HOLT MCDOUGAL
Publisher:
HOLT MCDOUGAL
Glencoe Algebra 1, Student Edition, 9780079039897…
Algebra
ISBN:
9780079039897
Author:
Carter
Publisher:
McGraw Hill
Holt Mcdougal Larson Pre-algebra: Student Edition…
Algebra
ISBN:
9780547587776
Author:
HOLT MCDOUGAL
Publisher:
HOLT MCDOUGAL