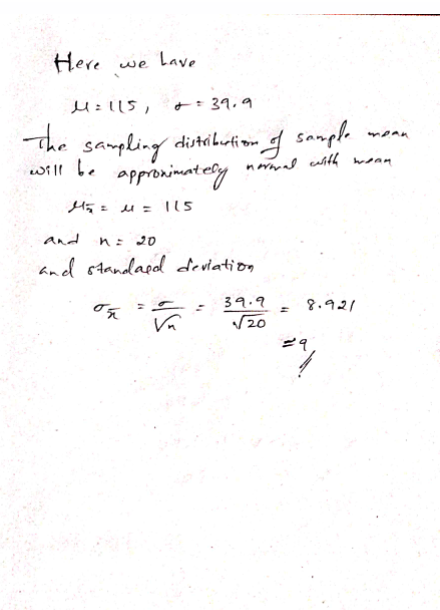
Use the central limit theorem to find the mean and standard error of the mean of the indicated sampling distribution. Then sketch a graph of the sampling distribution. The per capita consumption of red meat by people in a country in a recent year was normally distributed, with a mean of 115 pounds and a standard deviation of 39.9 pounds. Random samples of size 20 are drawn from this population and the mean of each sample is determined.
Use the central limit theorem to find the mean and standard error of the mean of the indicated sampling distribution. Then sketch a graph of the sampling distribution. The per capita consumption of red meat by people in a country in a recent year was normally distributed, with a mean of 115 pounds and a standard deviation of 39.9 pounds. Random samples of size 20 are drawn from this population and the mean of each sample is determined.

Glencoe Algebra 1, Student Edition, 9780079039897, 0079039898, 2018
18th Edition
ISBN:9780079039897
Author:Carter
Publisher:Carter
Chapter10: Statistics
Section10.4: Distributions Of Data
Problem 19PFA

Related questions
Question

Transcribed Image Text:Use the central limit theorem to find the mean and standard error of the mean of the indicated
sampling distribution. Then sketch a graph of the sampling distribution.
The per capita consumption of red meat by people in a country in a recent year was normally
distributed, with a mean of 115 pounds and a standard deviation of 39.9 pounds. Random
samples of size 20 are drawn from this population and the mean of each sample is determined.
Get more help-
Clear all
Check answer
Expert Solution
Step 1

Trending now
This is a popular solution!

Step by step
Solved in 2 steps with 1 images

Recommended textbooks for you
Glencoe Algebra 1, Student Edition, 9780079039897…
Algebra
ISBN:
9780079039897
Author:
Carter
Publisher:
McGraw Hill
Glencoe Algebra 1, Student Edition, 9780079039897…
Algebra
ISBN:
9780079039897
Author:
Carter
Publisher:
McGraw Hill