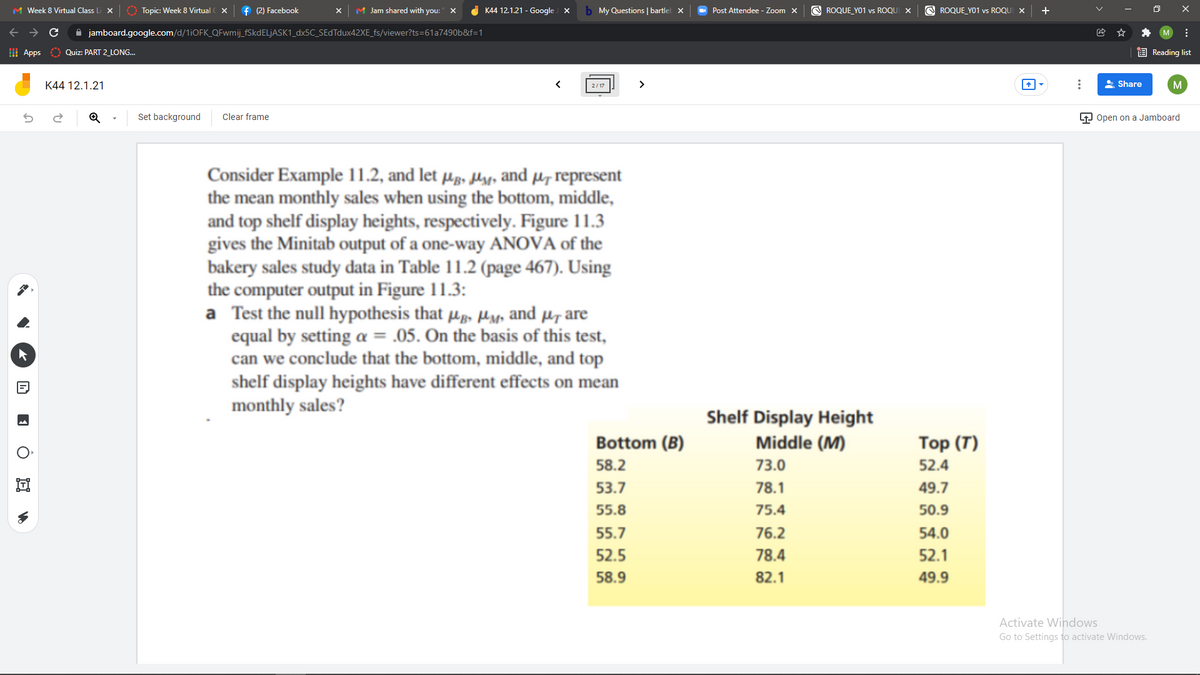
Consider Example 11.2, and let Hp» Hsy, and µ, represent the mean monthly sales when using the bottom, middle, and top shelf display heights, respectively. Figure 11.3 gives the Minitab output of a one-way ANOVA of the bakery sales study data in Table 11.2 (page 467). Using the computer output in Figure 11.3: a Test the null hypothesis that µ, Har and µ, are equal by setting a = .05. On the basis of this test, can we conclude that the bottom, middle, and top shelf display heights have different effects on mean monthly sales? Shelf Display Height Middle (M) Bottom (B) Top (T) 58.2 73.0 52.4 53.7 78.1 49.7 55.8 75.4 50.9 55.7 76.2 54.0 52.5 78.4 52.1 58.9 82.1 49.9
Consider Example 11.2, and let Hp» Hsy, and µ, represent the mean monthly sales when using the bottom, middle, and top shelf display heights, respectively. Figure 11.3 gives the Minitab output of a one-way ANOVA of the bakery sales study data in Table 11.2 (page 467). Using the computer output in Figure 11.3: a Test the null hypothesis that µ, Har and µ, are equal by setting a = .05. On the basis of this test, can we conclude that the bottom, middle, and top shelf display heights have different effects on mean monthly sales? Shelf Display Height Middle (M) Bottom (B) Top (T) 58.2 73.0 52.4 53.7 78.1 49.7 55.8 75.4 50.9 55.7 76.2 54.0 52.5 78.4 52.1 58.9 82.1 49.9

Trigonometry (MindTap Course List)
10th Edition
ISBN:9781337278461
Author:Ron Larson
Publisher:Ron Larson
Chapter6: Topics In Analytic Geometry
Section6.4: Hyperbolas
Problem 5ECP: Repeat Example 5 when microphone A receives the sound 4 seconds before microphone B.

Related questions
Question
Transcribed Image Text:M Week 8 Virtual Class Li X
O Topic: Week 8 Virtual
f (2) Facebook
M Jam shared with you:
K44 12.1.21 - Google X
b My Questions |bartlel x
O Post Attendee - Zoom X
O ROQUE_YO1 vs ROQUI X
O ROQUE YO1 vs ROQUI X
+
A jamboard.google.com/d/11OFK_QFwmij_FSKDELJASK1_dx5C_SEdTdux42XE_fs/viewer?ts=61a7490b&f=1
I Apps
E Reading list
Quiz: PART 2 LONG..
K44 12.1.21
>
A Share
2/17
Set background
Clear frame
P Open on a Jamboard
Consider Example 11.2, and let µg, ly, and µ, represent
the mean monthly sales when using the bottom, middle,
and top shelf display heights, respectively. Figure 11.3
gives the Minitab output of a one-way ANOVA of the
bakery sales study data in Table 11.2 (page 467). Using
the computer output in Figure 11.3:
a Test the null hypothesis that µp, Hyp and µr are
equal by setting a = .05. On the basis of this test,
can we conclude that the bottom, middle, and top
shelf display heights have different effects on mean
monthly sales?
Shelf Display Height
Bottom (B)
Middle (M)
Тop (T)
58.2
73.0
52.4
53.7
78.1
49.7
55.8
75.4
50.9
55.7
76.2
54.0
52.5
78.4
52.1
58.9
82.1
49.9
Activate Windows
Go to Settings to activate Windows.
...
E O E vo
Expert Solution
This question has been solved!
Explore an expertly crafted, step-by-step solution for a thorough understanding of key concepts.

This is a popular solution!

Trending now
This is a popular solution!

Step by step
Solved in 2 steps with 1 images

Recommended textbooks for you
Trigonometry (MindTap Course List)
Trigonometry
ISBN:
9781337278461
Author:
Ron Larson
Publisher:
Cengage Learning

Algebra & Trigonometry with Analytic Geometry
Algebra
ISBN:
9781133382119
Author:
Swokowski
Publisher:
Cengage
Trigonometry (MindTap Course List)
Trigonometry
ISBN:
9781337278461
Author:
Ron Larson
Publisher:
Cengage Learning
Algebra & Trigonometry with Analytic Geometry
Algebra
ISBN:
9781133382119
Author:
Swokowski
Publisher:
Cengage