Consider the boxplot below. 16 34 45 59 71 10 20 30 40 data 50 60 70 80 a. What quarter has the largest spread of data?
Consider the boxplot below. 16 34 45 59 71 10 20 30 40 data 50 60 70 80 a. What quarter has the largest spread of data?

Mathematics For Machine Technology
8th Edition
ISBN:9781337798310
Author:Peterson, John.
Publisher:Peterson, John.
Chapter29: Tolerance, Clearance, And Interference
Section: Chapter Questions
Problem 16A: Spacers are manufactured to the mean dimension and tolerance shown in Figure 29-12. An inspector...

Related questions
Question
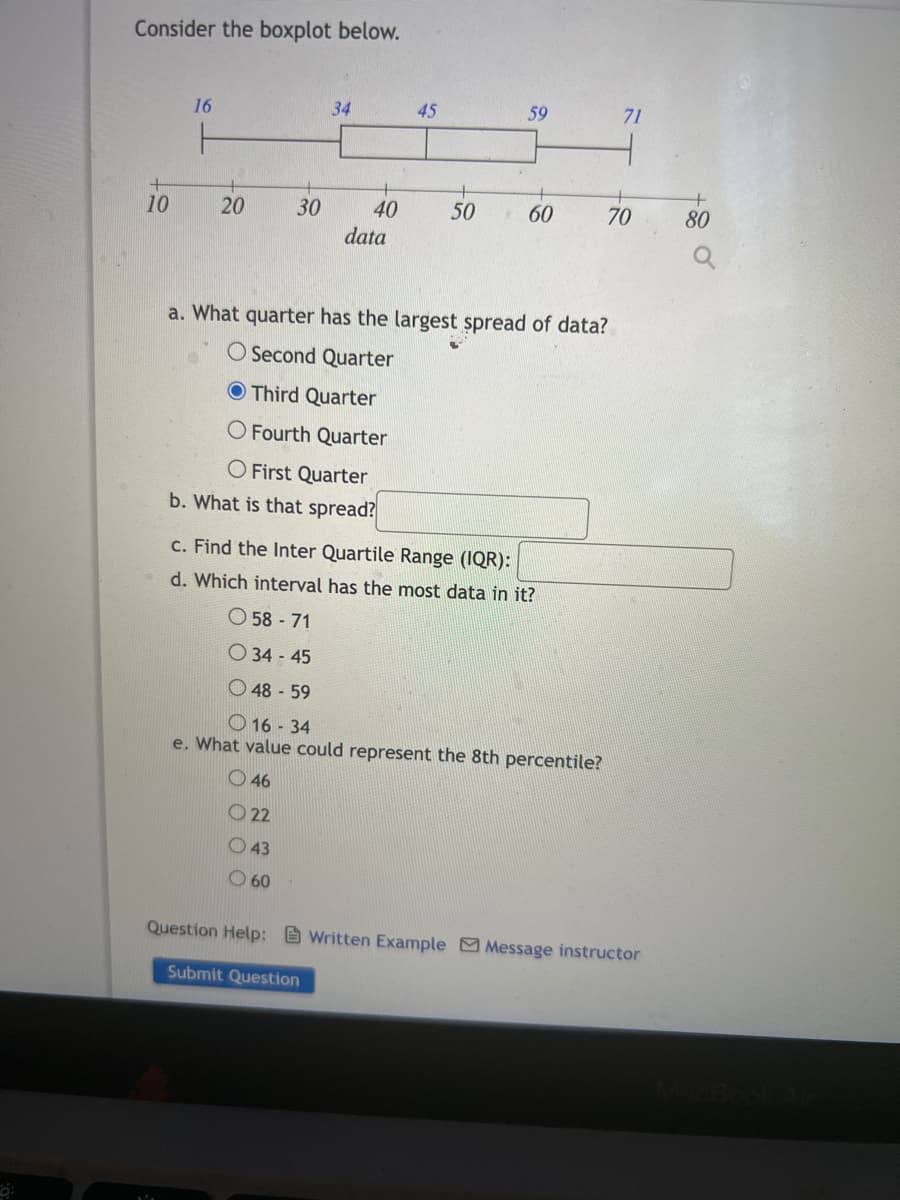
Transcribed Image Text:Consider the boxplot below.
16
34
45
59
71
10
20
30
40
50
60
70
80
data
a. What quarter has the largest spread of data?
O Second Quarter
O Third Quarter
O Fourth Quarter
O First Quarter
b. What is that spread?
c. Find the Inter Quartile Range (IQR):
d. Which interval has the most data in it?
O 58 - 71
O 34 - 45
O 48 - 59
O 16 - 34
e. What value could represent the 8th percentile?
O 46
O 22
O 43
O 60
Question Help: B Written Example Message instructor
Submit Question
Expert Solution
Step 1
Given :
Minimum = 16
Q1 = 34
Q2 = 45
Q3 = 59
Maximum = 71

Trending now
This is a popular solution!

Step by step
Solved in 2 steps

Recommended textbooks for you
Mathematics For Machine Technology
Advanced Math
ISBN:
9781337798310
Author:
Peterson, John.
Publisher:
Cengage Learning,

Glencoe Algebra 1, Student Edition, 9780079039897…
Algebra
ISBN:
9780079039897
Author:
Carter
Publisher:
McGraw Hill
Mathematics For Machine Technology
Advanced Math
ISBN:
9781337798310
Author:
Peterson, John.
Publisher:
Cengage Learning,
Glencoe Algebra 1, Student Edition, 9780079039897…
Algebra
ISBN:
9780079039897
Author:
Carter
Publisher:
McGraw Hill