Consider the data in the table below. Y 3 1 5 4 8 3 1 7 1. In the space below (or on a separate sheet of paper), plot all observations of the table above and draw the OLS regression line. You can estimate the slope and constant of the OLS regression line by hand, with Stata, or with Excel (you don't have to show your workings). Don't forget to label the axes.
Consider the data in the table below. Y 3 1 5 4 8 3 1 7 1. In the space below (or on a separate sheet of paper), plot all observations of the table above and draw the OLS regression line. You can estimate the slope and constant of the OLS regression line by hand, with Stata, or with Excel (you don't have to show your workings). Don't forget to label the axes.

Chapter4: Linear Functions
Section: Chapter Questions
Problem 40RE: For the following exercises, consider the data in Table 5, which shows the percent of unemployed ina...

Related questions
Question
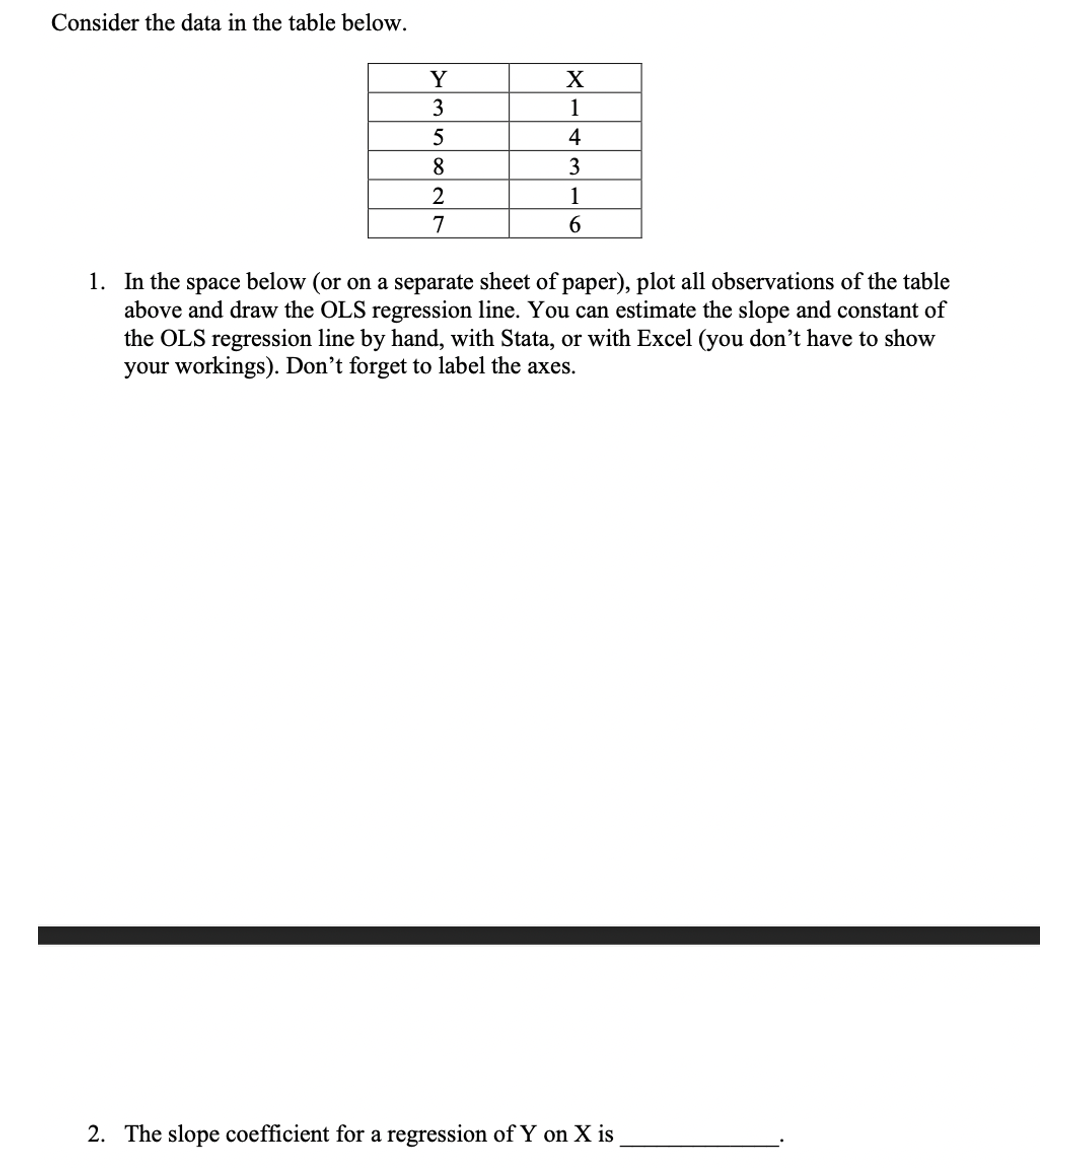
Transcribed Image Text:Consider the data in the table below.
Y
X
3
1
4
8
3
1
7
6.
1. In the space below (or on a separate sheet of paper), plot all observations of the table
above and draw the OLS regression line. You can estimate the slope and constant of
the OLS regression line by hand, with Stata, or with Excel (you don't have to show
your workings). Don't forget to label the axes.
2. The slope coefficient for a regression of Y on X is
Expert Solution
This question has been solved!
Explore an expertly crafted, step-by-step solution for a thorough understanding of key concepts.

Step by step
Solved in 2 steps with 3 images

Recommended textbooks for you

Functions and Change: A Modeling Approach to Coll…
Algebra
ISBN:
9781337111348
Author:
Bruce Crauder, Benny Evans, Alan Noell
Publisher:
Cengage Learning

Algebra & Trigonometry with Analytic Geometry
Algebra
ISBN:
9781133382119
Author:
Swokowski
Publisher:
Cengage
Functions and Change: A Modeling Approach to Coll…
Algebra
ISBN:
9781337111348
Author:
Bruce Crauder, Benny Evans, Alan Noell
Publisher:
Cengage Learning
Algebra & Trigonometry with Analytic Geometry
Algebra
ISBN:
9781133382119
Author:
Swokowski
Publisher:
Cengage

College Algebra
Algebra
ISBN:
9781305115545
Author:
James Stewart, Lothar Redlin, Saleem Watson
Publisher:
Cengage Learning

Algebra and Trigonometry (MindTap Course List)
Algebra
ISBN:
9781305071742
Author:
James Stewart, Lothar Redlin, Saleem Watson
Publisher:
Cengage Learning