Section 12.2 Exercises 27. The color of candy Inspired by the example about how background music influences choice of entrée at a restaurant, a statistics student decided to investigate other ways to influence a person's behavior. Using 60 volunteers, she randomly assigned 20 volunteers to get a “red" survey, 20 volunteers to get a “blue" survey, and 20 volunteers to get a control survey. The first three questions on each survey were the same, but the fourth and fifth questions were different. For example, the fourth question on the “red" survey was "When you think of the color red, what do you think about?" On the blue survey, the question replaced red with blue. On the control survey, the last two questions were not about color. As a reward, each volunteer was allowed to choose a chocolate candy in a red wrapper or a chocolate candy in a blue wrapper. Here are segmented bar graphs showing the results of the experiment. Describe what you see. 100 Red candy Blue candy Red Blue Control survey survey survey Type of survey Starnes & Tabor, The Practice of Statistics, 6e, © 2018 Bedford, Freeman & Worth High School Publishers 29. More candy The two-way table shows the results of the experiment described in pg Exercise 27. 783 Survey type Red Blue Control Total Red 13 8 26 Blue 7 |15 |12 34 Color of candy Total 20 20 20 60 a. State the appropriate null and alternative hypotheses. b. Show the calculation for the expected count in the Red/Red cell. Then provide a complete table of expected counts. c. Calculate the value of the chi-square test statistic. Percent 29 Neutral DIOn Total Yes 38 75 129 No. Total 1. 18 Hatching status 104 27 a. State the appropriate null and alternative hypotheses. b. Show the calculation for the expected count in the Cold/Yes cell. Then provide a complete table of expected counts. c. Calculate the value of the chi-square test statistic. 31. Last candy Refer to Exercises 27 and 29. pg. a. Verify that the conditions for inference are met. b. Use Table C to find the P-value. Then use your calculator's y'cdf command. c. Interpret the P-value from the calculator. d. What conclusion would you draw using a = =0.01? 32. Last python Refer to Exercises 28 and 30, a. Verify that the conditions for interence are met. b. Use Table C to find the P-value. Then use your calculator's xcdf command.
Section 12.2 Exercises 27. The color of candy Inspired by the example about how background music influences choice of entrée at a restaurant, a statistics student decided to investigate other ways to influence a person's behavior. Using 60 volunteers, she randomly assigned 20 volunteers to get a “red" survey, 20 volunteers to get a “blue" survey, and 20 volunteers to get a control survey. The first three questions on each survey were the same, but the fourth and fifth questions were different. For example, the fourth question on the “red" survey was "When you think of the color red, what do you think about?" On the blue survey, the question replaced red with blue. On the control survey, the last two questions were not about color. As a reward, each volunteer was allowed to choose a chocolate candy in a red wrapper or a chocolate candy in a blue wrapper. Here are segmented bar graphs showing the results of the experiment. Describe what you see. 100 Red candy Blue candy Red Blue Control survey survey survey Type of survey Starnes & Tabor, The Practice of Statistics, 6e, © 2018 Bedford, Freeman & Worth High School Publishers 29. More candy The two-way table shows the results of the experiment described in pg Exercise 27. 783 Survey type Red Blue Control Total Red 13 8 26 Blue 7 |15 |12 34 Color of candy Total 20 20 20 60 a. State the appropriate null and alternative hypotheses. b. Show the calculation for the expected count in the Red/Red cell. Then provide a complete table of expected counts. c. Calculate the value of the chi-square test statistic. Percent 29 Neutral DIOn Total Yes 38 75 129 No. Total 1. 18 Hatching status 104 27 a. State the appropriate null and alternative hypotheses. b. Show the calculation for the expected count in the Cold/Yes cell. Then provide a complete table of expected counts. c. Calculate the value of the chi-square test statistic. 31. Last candy Refer to Exercises 27 and 29. pg. a. Verify that the conditions for inference are met. b. Use Table C to find the P-value. Then use your calculator's y'cdf command. c. Interpret the P-value from the calculator. d. What conclusion would you draw using a = =0.01? 32. Last python Refer to Exercises 28 and 30, a. Verify that the conditions for interence are met. b. Use Table C to find the P-value. Then use your calculator's xcdf command.

Glencoe Algebra 1, Student Edition, 9780079039897, 0079039898, 2018
18th Edition
ISBN:9780079039897
Author:Carter
Publisher:Carter
Chapter4: Equations Of Linear Functions
Section4.5: Correlation And Causation
Problem 15PPS

Related questions
Question
Just need help with number 31
Transcribed Image Text:Section 12.2 Exercises
27. The color of candy Inspired by the example about how background music
influences choice of entrée at a restaurant, a statistics student decided to investigate
other ways to influence a person's behavior. Using 60 volunteers, she randomly
assigned 20 volunteers to get a “red" survey, 20 volunteers to get a “blue" survey,
and 20 volunteers to get a control survey. The first three questions on each survey
were the same, but the fourth and fifth questions were different. For example, the
fourth question on the “red" survey was "When you think of the color red, what do
you think about?" On the blue survey, the question replaced red with blue. On the
control survey, the last two questions were not about color. As a reward, each
volunteer was allowed to choose a chocolate candy in a red wrapper or a chocolate
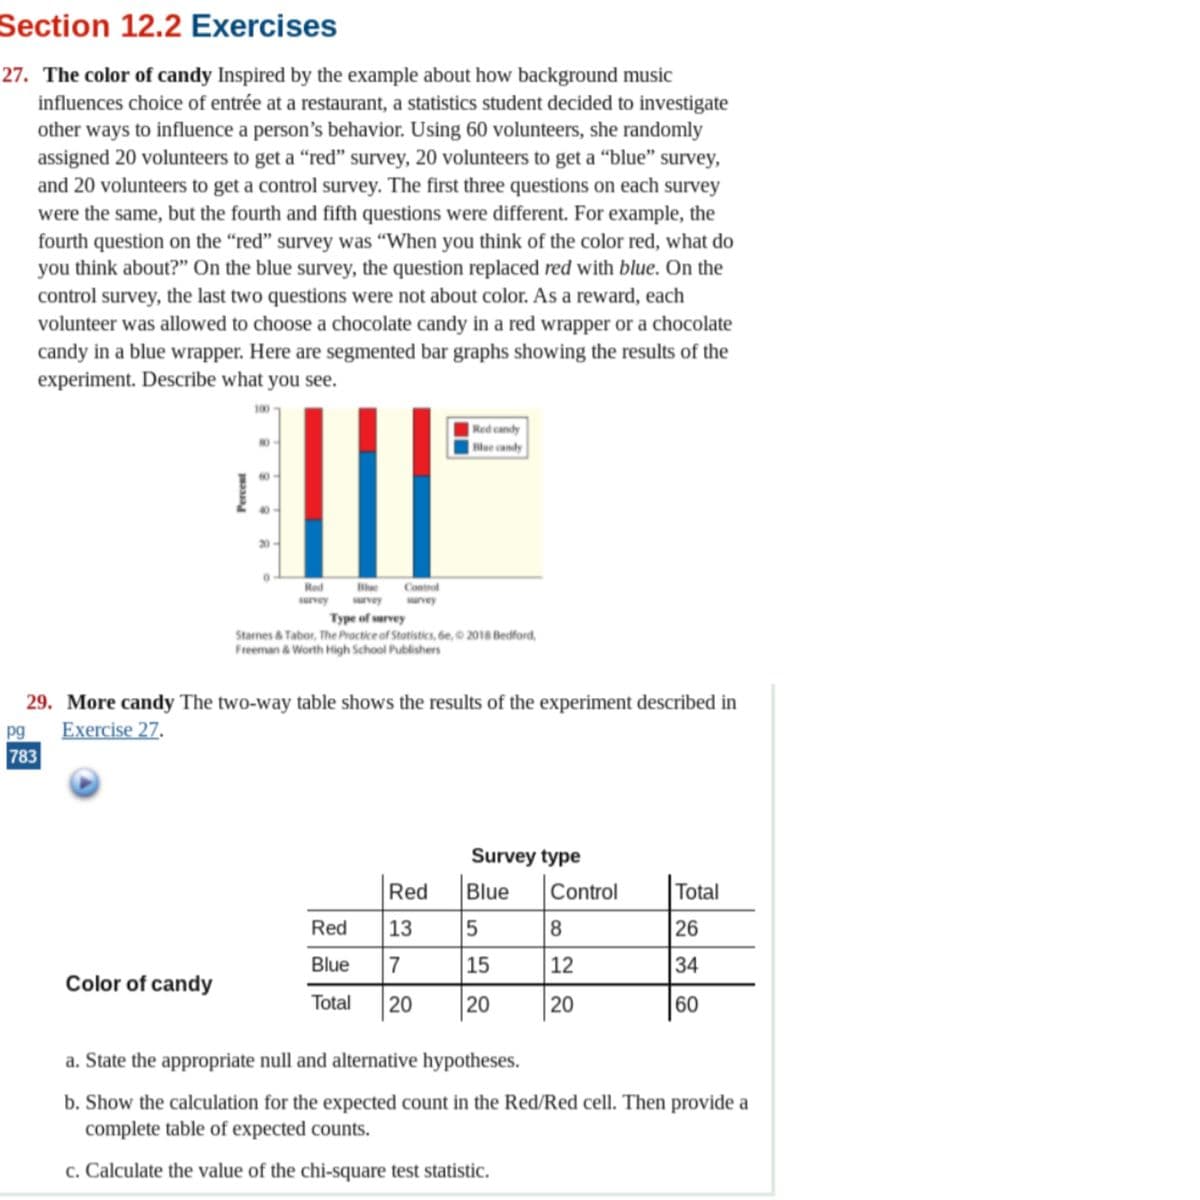
candy in a blue wrapper. Here are segmented bar graphs showing the results of the
experiment. Describe what you see.
100
Red candy
Blue candy
Red
Blue
Control
survey
survey
survey
Type of survey
Starnes & Tabor, The Practice of Statistics, 6e, © 2018 Bedford,
Freeman & Worth High School Publishers
29. More candy The two-way table shows the results of the experiment described in
pg
Exercise 27.
783
Survey type
Red
Blue
Control
Total
Red
13
8
26
Blue
7
|15
|12
34
Color of candy
Total
20
20
20
60
a. State the appropriate null and alternative hypotheses.
b. Show the calculation for the expected count in the Red/Red cell. Then provide a
complete table of expected counts.
c. Calculate the value of the chi-square test statistic.
Percent
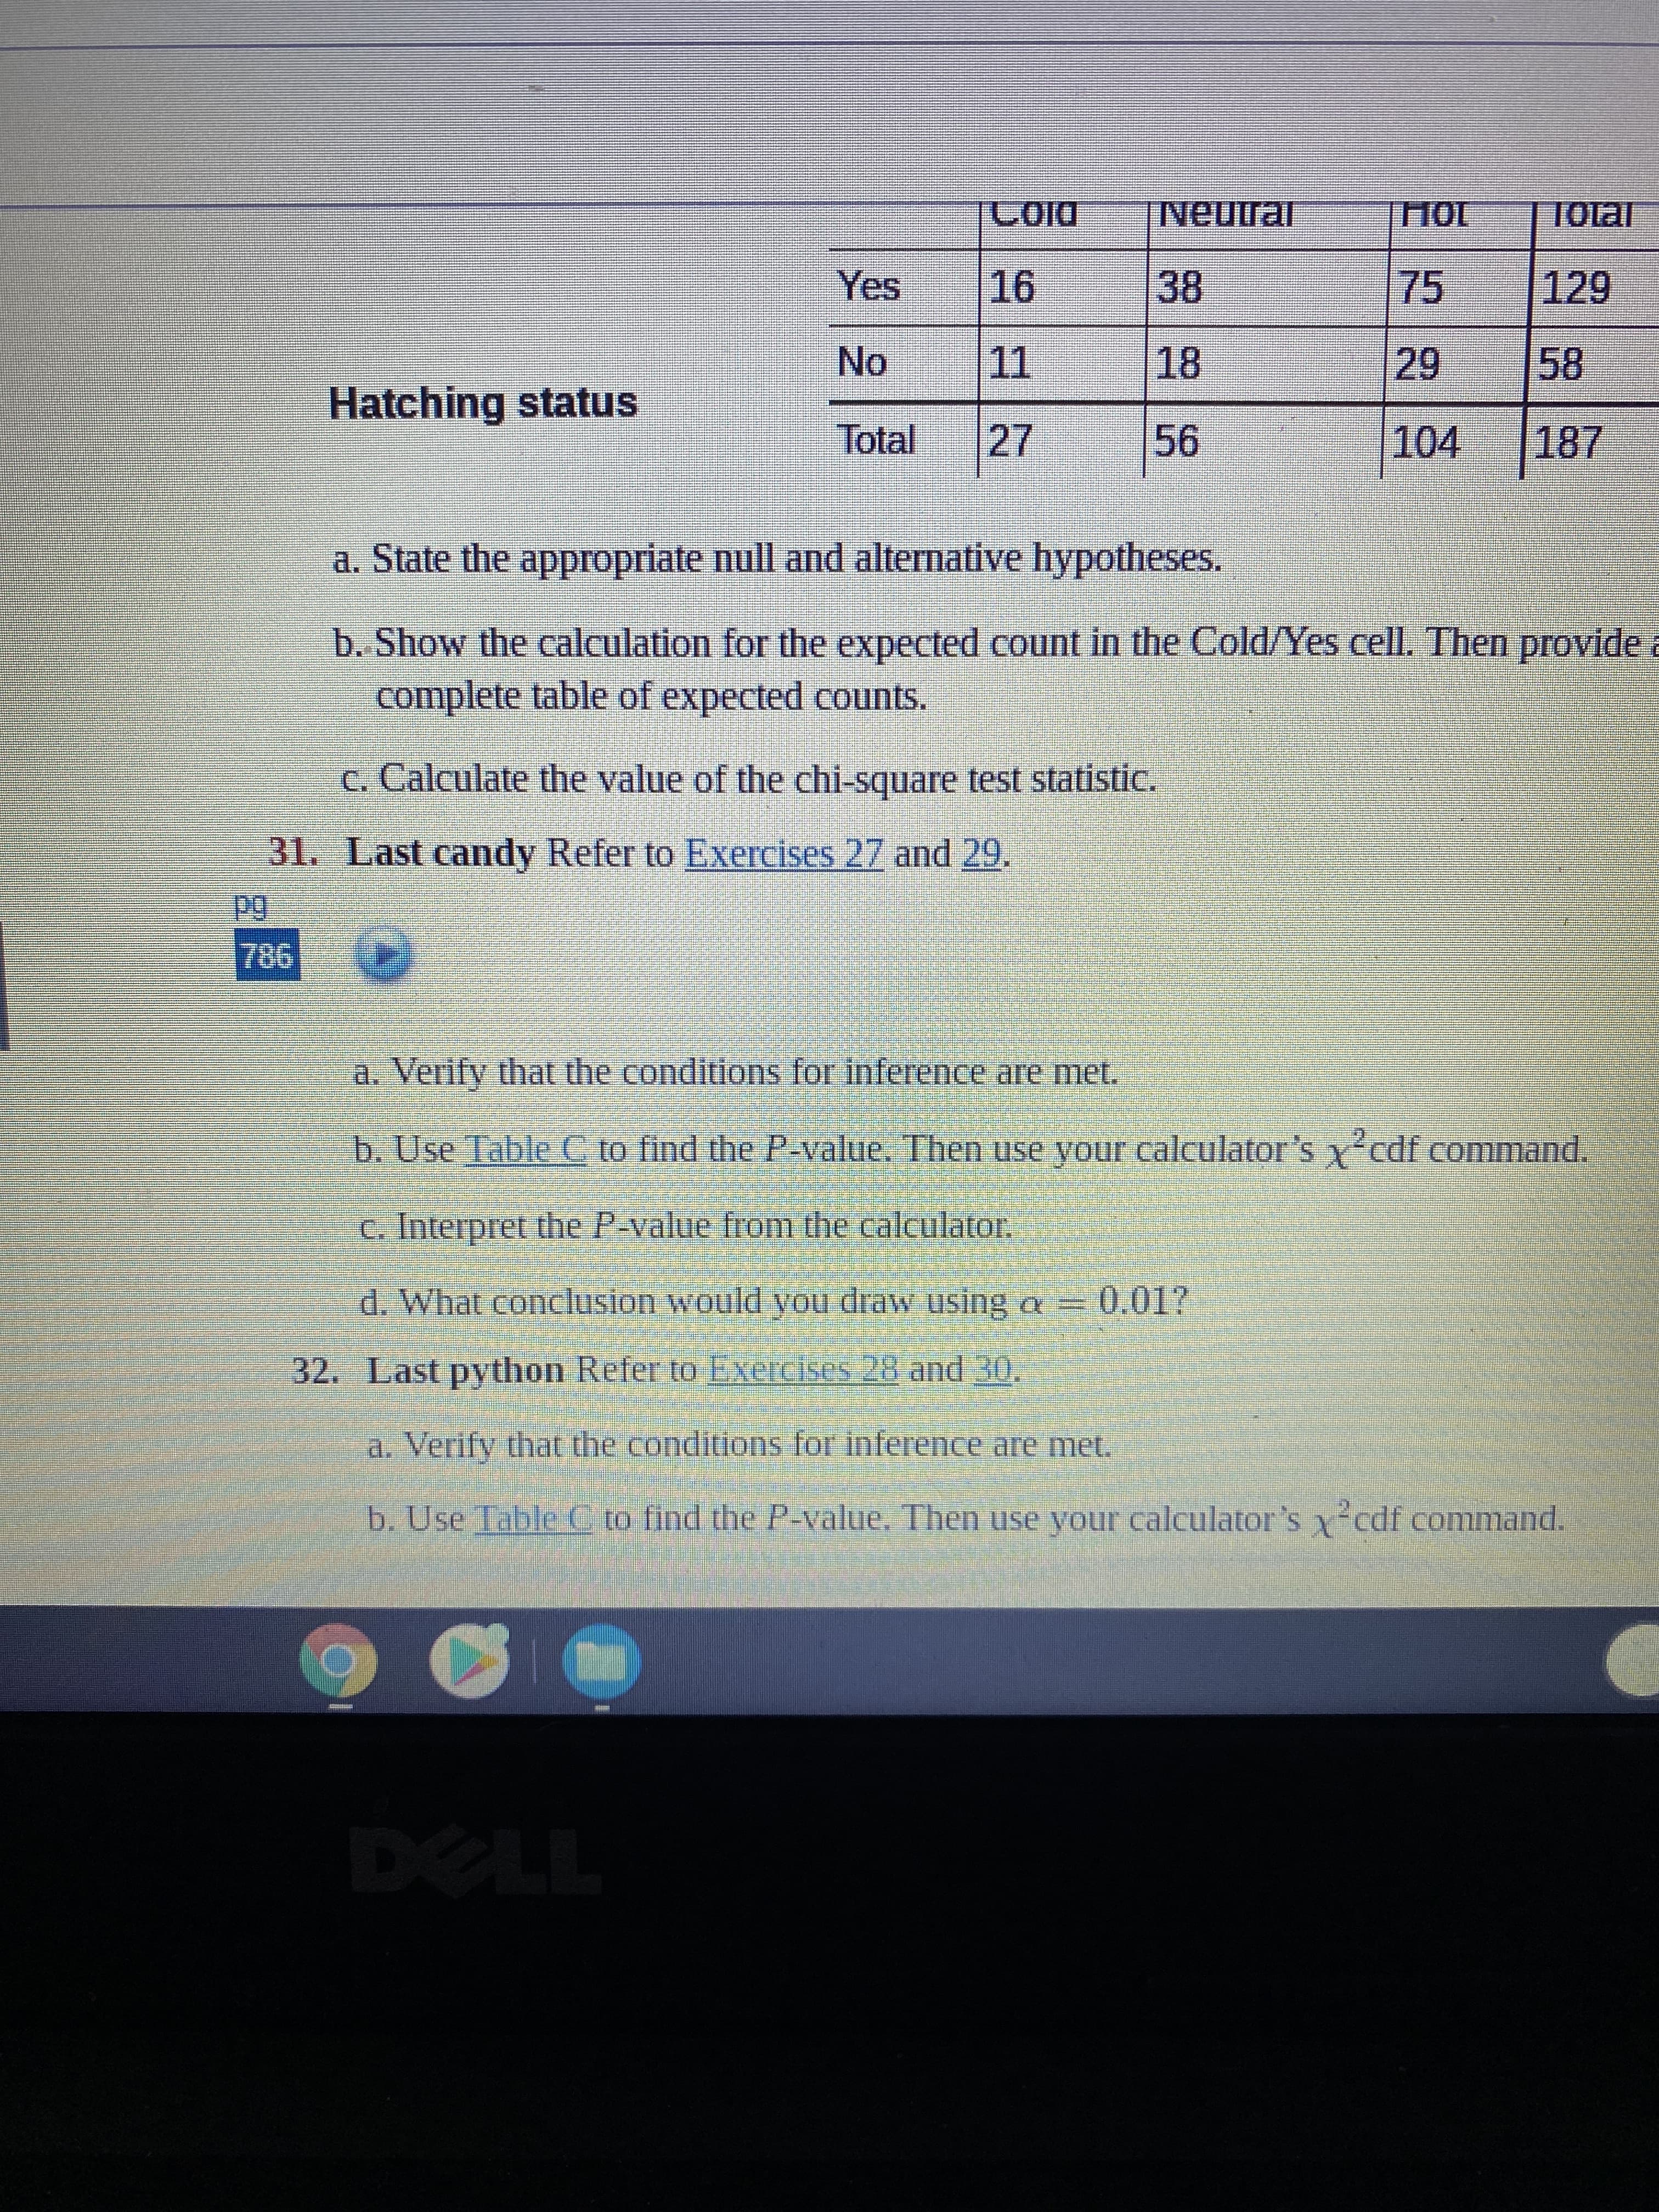
Transcribed Image Text:29
Neutral
DIOn
Total
Yes
38
75
129
No.
Total
1.
18
Hatching status
104
27
a. State the appropriate null and alternative hypotheses.
b. Show the calculation for the expected count in the Cold/Yes cell. Then provide a
complete table of expected counts.
c. Calculate the value of the chi-square test statistic.
31. Last candy Refer to Exercises 27 and 29.
pg.
a. Verify that the conditions for inference are met.
b. Use Table C to find the P-value. Then use your calculator's y'cdf command.
c. Interpret the P-value from the calculator.
d. What conclusion would you draw using a =
=0.01?
32. Last python Refer to Exercises 28 and 30,
a. Verify that the conditions for interence are met.
b. Use Table C to find the P-value. Then use your calculator's xcdf command.
Expert Solution
This question has been solved!
Explore an expertly crafted, step-by-step solution for a thorough understanding of key concepts.

This is a popular solution!

Trending now
This is a popular solution!

Step by step
Solved in 3 steps with 1 images

Recommended textbooks for you
Glencoe Algebra 1, Student Edition, 9780079039897…
Algebra
ISBN:
9780079039897
Author:
Carter
Publisher:
McGraw Hill


Big Ideas Math A Bridge To Success Algebra 1: Stu…
Algebra
ISBN:
9781680331141
Author:
HOUGHTON MIFFLIN HARCOURT
Publisher:
Houghton Mifflin Harcourt
Glencoe Algebra 1, Student Edition, 9780079039897…
Algebra
ISBN:
9780079039897
Author:
Carter
Publisher:
McGraw Hill
Big Ideas Math A Bridge To Success Algebra 1: Stu…
Algebra
ISBN:
9781680331141
Author:
HOUGHTON MIFFLIN HARCOURT
Publisher:
Houghton Mifflin Harcourt

Holt Mcdougal Larson Pre-algebra: Student Edition…
Algebra
ISBN:
9780547587776
Author:
HOLT MCDOUGAL
Publisher:
HOLT MCDOUGAL