Consider the data. 3 12 6 20 14 55 35 60 10 25 The estimated regression equation for these data is ŷ = 70 – 3x. (a) Compute SSE, SST, and SSR using equations SSE = E(y; - ŷ)?, sST = E(y, - y)2, and SSR = E(ŷ, - )?. SSE = SST = SSR = (b) Compute the coefficient of determination rt. (Round your answer to three decimal places.) Comment on the goodness of fit. (For purposes of this exercise, consider a proportion large if it is at least 0.55.) The least squares line did not provide a good fit as a small proportion of the variability in y has been explained by the least squares line. O The least squares line provided a good fit as a large proportion of the variability in y has been explained by the least squares line. The least squares line provided a good fit as a small proportion of the variability in y has been explained by the least squares line. The least squares line did not provide a good fit as a large proportion of the variability in y has been explained by the least squares line. (c) Compute the sample correlation coefficient. (Round your answer to three decimal places.)
Consider the data. 3 12 6 20 14 55 35 60 10 25 The estimated regression equation for these data is ŷ = 70 – 3x. (a) Compute SSE, SST, and SSR using equations SSE = E(y; - ŷ)?, sST = E(y, - y)2, and SSR = E(ŷ, - )?. SSE = SST = SSR = (b) Compute the coefficient of determination rt. (Round your answer to three decimal places.) Comment on the goodness of fit. (For purposes of this exercise, consider a proportion large if it is at least 0.55.) The least squares line did not provide a good fit as a small proportion of the variability in y has been explained by the least squares line. O The least squares line provided a good fit as a large proportion of the variability in y has been explained by the least squares line. The least squares line provided a good fit as a small proportion of the variability in y has been explained by the least squares line. The least squares line did not provide a good fit as a large proportion of the variability in y has been explained by the least squares line. (c) Compute the sample correlation coefficient. (Round your answer to three decimal places.)

Functions and Change: A Modeling Approach to College Algebra (MindTap Course List)
6th Edition
ISBN:9781337111348
Author:Bruce Crauder, Benny Evans, Alan Noell
Publisher:Bruce Crauder, Benny Evans, Alan Noell
Chapter5: A Survey Of Other Common Functions
Section5.6: Higher-degree Polynomials And Rational Functions
Problem 1TU: The following fictitious table shows kryptonite price, in dollar per gram, t years after 2006. t=...

Related questions
Question
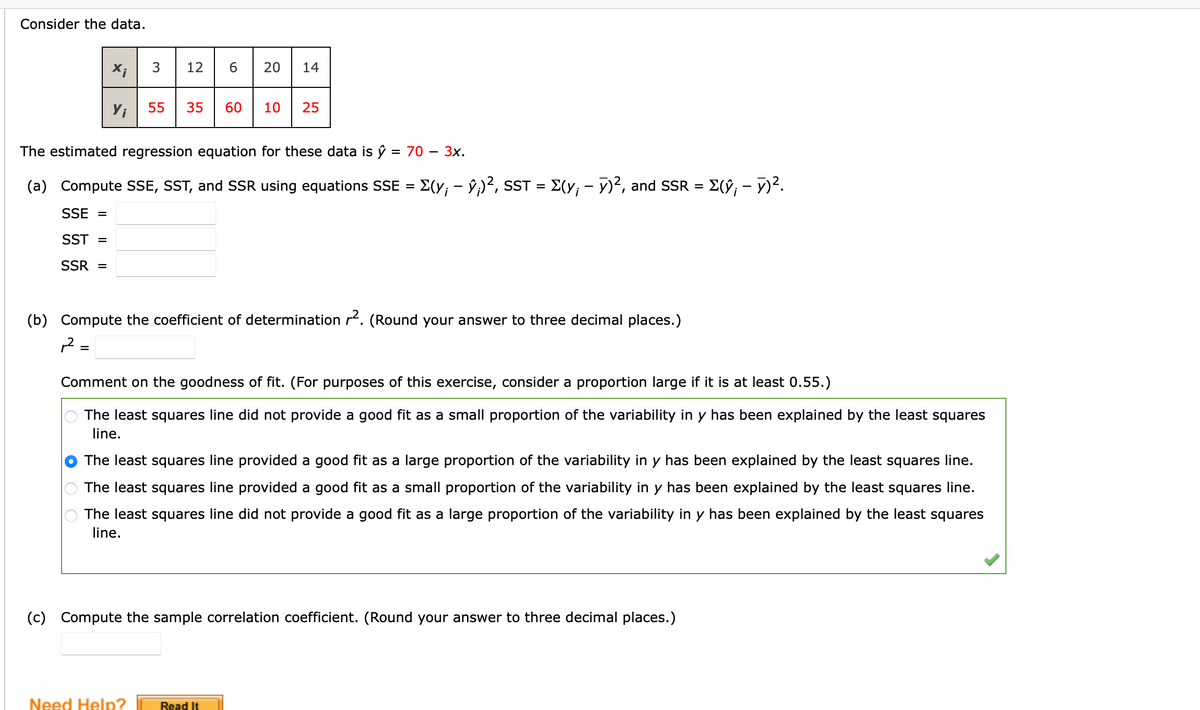
Transcribed Image Text:Consider the data.
X;
3
12
20
14
Yi
55
35
60
10
25
The estimated regression equation for these data is ŷ = 70 – 3x.
%D
(a) Compute SSE, SST, and SSR using equations SSE = E(y; - ŷ;)², SST = E(y; - y)², and SSR =
E(9; - 7)².
SSE =
SST =
SSR =
(b) Compute the coefficient of determination r. (Round your answer to three decimal places.)
,2 =
%D
Comment on the goodness of fit. (For purposes of this exercise, consider a proportion large if it is at least 0.55.)
The least squares line did not provide a good fit as a small proportion of the variability in y has been explained by the least squares
line.
The least squares line provided a good fit as a large proportion of the variability in y has been explained by the least squares line.
The least squares line provided a good fit as a small proportion of the variability in y has been explained by the least squares line.
The least squares line did not provide a good fit as a large proportion of the variability in y has been explained by the least squares
line.
(c) Compute the sample correlation coefficient. (Round your answer to three decimal places.)
Need Help?
Read It
Expert Solution
Step 1
Given
| Xi | 3 | 12 | 6 | 20 | 14 |
| Yi | 55 | 35 | 60 | 10 | 25 |

Step by step
Solved in 4 steps with 3 images

Recommended textbooks for you
Functions and Change: A Modeling Approach to Coll…
Algebra
ISBN:
9781337111348
Author:
Bruce Crauder, Benny Evans, Alan Noell
Publisher:
Cengage Learning
Functions and Change: A Modeling Approach to Coll…
Algebra
ISBN:
9781337111348
Author:
Bruce Crauder, Benny Evans, Alan Noell
Publisher:
Cengage Learning