Consider the diagram below and select the correct statement. и The green and blue curve represent normal distributions with the same mean.. The green and red curve represent normal distributions with the same standard deviation. O The blue and red curve represent normal distributions with the same mean. O The green and blue curve represent normal distributions with the same standard deviation.
Consider the diagram below and select the correct statement. и The green and blue curve represent normal distributions with the same mean.. The green and red curve represent normal distributions with the same standard deviation. O The blue and red curve represent normal distributions with the same mean. O The green and blue curve represent normal distributions with the same standard deviation.

Glencoe Algebra 1, Student Edition, 9780079039897, 0079039898, 2018
18th Edition
ISBN:9780079039897
Author:Carter
Publisher:Carter
Chapter10: Statistics
Section10.5: Comparing Sets Of Data
Problem 24HP

Related questions
Question
Transcribed Image Text:Question 1
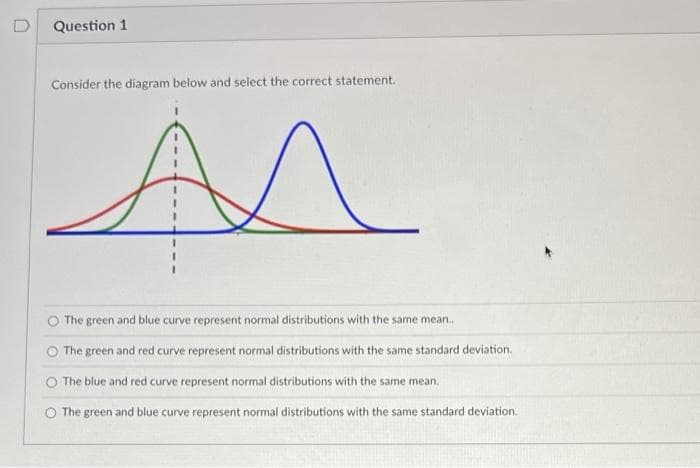
Consider the diagram below and select the correct statement.
Ar ^
O The green and blue curve represent normal distributions with the same mean...
The green and red curve represent normal distributions with the same standard deviation.
The blue and red curve represent normal distributions with the same mean.
O The green and blue curve represent normal distributions with the same standard deviation.
Expert Solution
This question has been solved!
Explore an expertly crafted, step-by-step solution for a thorough understanding of key concepts.

Step by step
Solved in 2 steps with 1 images

Recommended textbooks for you
Glencoe Algebra 1, Student Edition, 9780079039897…
Algebra
ISBN:
9780079039897
Author:
Carter
Publisher:
McGraw Hill

Big Ideas Math A Bridge To Success Algebra 1: Stu…
Algebra
ISBN:
9781680331141
Author:
HOUGHTON MIFFLIN HARCOURT
Publisher:
Houghton Mifflin Harcourt
Glencoe Algebra 1, Student Edition, 9780079039897…
Algebra
ISBN:
9780079039897
Author:
Carter
Publisher:
McGraw Hill
Big Ideas Math A Bridge To Success Algebra 1: Stu…
Algebra
ISBN:
9781680331141
Author:
HOUGHTON MIFFLIN HARCOURT
Publisher:
Houghton Mifflin Harcourt