Consider the following 29 years worth of observed annual rainfall data (in inches) for a certain weather station shown. Treat the data as samples only. (Note: The data are arranged in chronological manner.) 43.30 53.02 63.52 45.93 48.26 50.51 49.57 43.93 46.77 59.12 54.49 47.38 40.78 45.05 50.37 54.91 51.28 40.01 53.29 67.59 58.71 42.96 55.77 41.31 58.83 48.21 44.67 67.72 43.11 (a) Make a time-series line graph showing the trend of observed rainfall data through time. (For year, just denote it as Year 1, Year 2 etc.). Draw the line graph by hand. (b) Make a grouped data representing the given rainfall data. Use the following class intervals: 40<=X<45, 45<=X<50, 50<=X<55, 55<=X<60, 60<=X<65, and 65<=X<70. (c) Using the grouped data from (b), calculate the following: • mean, median, and mode • variance, standard deviation, coefficient of variation, second coefficient of skewness (classify also if the data set is symmetric, positively skewed, or negatively skewed), and coefficient of kurtosis (classify also if the data set is mesokurtic, platykurtic, or leptokurtic) 3rd quartile, 8th decile, and 85th percentile
Consider the following 29 years worth of observed annual rainfall data (in inches) for a certain weather station shown. Treat the data as samples only. (Note: The data are arranged in chronological manner.) 43.30 53.02 63.52 45.93 48.26 50.51 49.57 43.93 46.77 59.12 54.49 47.38 40.78 45.05 50.37 54.91 51.28 40.01 53.29 67.59 58.71 42.96 55.77 41.31 58.83 48.21 44.67 67.72 43.11 (a) Make a time-series line graph showing the trend of observed rainfall data through time. (For year, just denote it as Year 1, Year 2 etc.). Draw the line graph by hand. (b) Make a grouped data representing the given rainfall data. Use the following class intervals: 40<=X<45, 45<=X<50, 50<=X<55, 55<=X<60, 60<=X<65, and 65<=X<70. (c) Using the grouped data from (b), calculate the following: • mean, median, and mode • variance, standard deviation, coefficient of variation, second coefficient of skewness (classify also if the data set is symmetric, positively skewed, or negatively skewed), and coefficient of kurtosis (classify also if the data set is mesokurtic, platykurtic, or leptokurtic) 3rd quartile, 8th decile, and 85th percentile

Functions and Change: A Modeling Approach to College Algebra (MindTap Course List)
6th Edition
ISBN:9781337111348
Author:Bruce Crauder, Benny Evans, Alan Noell
Publisher:Bruce Crauder, Benny Evans, Alan Noell
Chapter5: A Survey Of Other Common Functions
Section5.3: Modeling Data With Power Functions
Problem 6E: Urban Travel Times Population of cities and driving times are related, as shown in the accompanying...

Related questions
Question
100%
Kindly show your complete solution, you can use excel. Thank you!
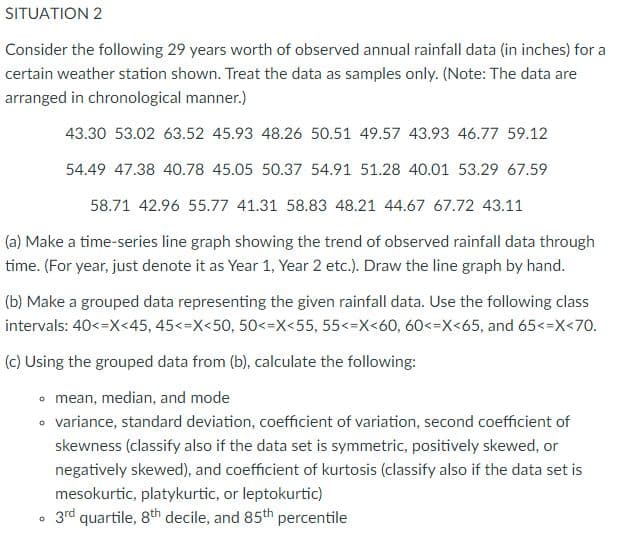
Transcribed Image Text:SITUATION 2
Consider the following 29 years worth of observed annual rainfall data (in inches) for a
certain weather station shown. Treat the data as samples only. (Note: The data are
arranged in chronological manner.)
43.30 53.02 63.52 45.93 48.26 50.51 49.57 43.93 46.77 59.12
54.49 47.38 40.78 45.05 50.37 54.91 51.28 40.01 53.29 67.59
58.71 42.96 55.77 41.31 58.83 48.21 44.67 67.72 43.11
(a) Make a time-series line graph showing the trend of observed rainfall data through
time. (For year, just denote it as Year 1, Year 2 etc.). Draw the line graph by hand.
(b) Make a grouped data representing the given rainfall data. Use the following class
intervals: 40<=X<45, 45<=X<50, 50<=X<55, 55<=X<60, 60<=X<65, and 65<=X<70.
(c) Using the grouped data from (b), calculate the following:
• mean, median, and mode
• variance, standard deviation, coefficient of variation, second coefficient of
skewness (classify also if the data set is symmetric, positively skewed, or
negatively skewed), and coefficient of kurtosis (classify also if the data set is
mesokurtic, platykurtic, or leptokurtic)
3rd quartile, 8th decile, and 85th percentile
Expert Solution
This question has been solved!
Explore an expertly crafted, step-by-step solution for a thorough understanding of key concepts.

This is a popular solution!

Trending now
This is a popular solution!

Step by step
Solved in 5 steps with 3 images

Recommended textbooks for you
Functions and Change: A Modeling Approach to Coll…
Algebra
ISBN:
9781337111348
Author:
Bruce Crauder, Benny Evans, Alan Noell
Publisher:
Cengage Learning
Functions and Change: A Modeling Approach to Coll…
Algebra
ISBN:
9781337111348
Author:
Bruce Crauder, Benny Evans, Alan Noell
Publisher:
Cengage Learning