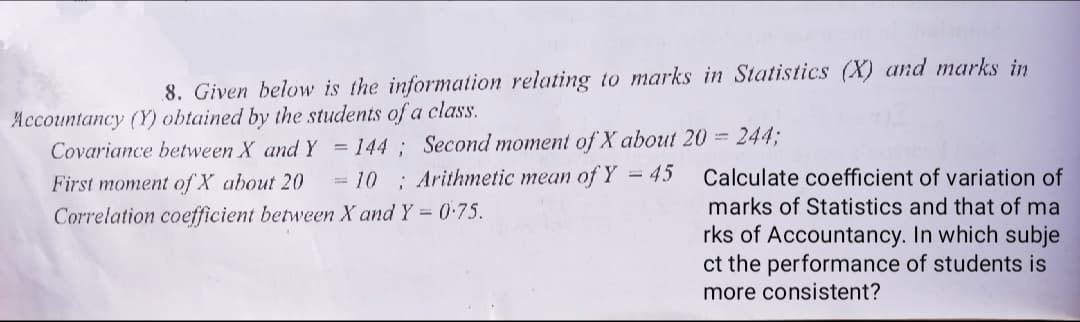
8. Given below is the information relating to marks in Statistics (X) and marks in Accountancy (Y) obtained by the students of a class. Covariance between X and Y = 144 ; Second moment of X about 20 244; First moment of X about 20 = 10 ; Arithmetic mean ofY = 45 Calculate coefficient of variation of marks of Statistics and that of ma Correlation coefficient between X and Y = 0-75. rks of Accountancy. In which subje ct the performance of students is more consistent?


Q: The biconditional of two true propositional variables or two false propositional Varlables is A True...
A:
Q: Question Percentage of a population that uses a social media The accompanying table contains the per...
A: Given: Sr. No. Data 1 5 2 6 3 16 4 19 5 25 6 28 7 29 8 32 9 36 10 37 11 ...
Q: 4. The quantity of Calcium level in the blood of a man follows a normal distribution with a standard...
A: Introduction: It is required to identify the confidence level, which suggests that the confidence in...
Q: The average battery life of the iPhone X is reported to be 11 hours by appleinsider.com. Assume tha...
A: Given μ=11 hours, n=30, σ=30 min
Q: The average score on a statistics test was 2.42 with a standard deviation of 0.81. The teacher suspe...
A:
Q: • Question 2 Assume that a sample is used to estimate a population mean µ. Find the margin of error ...
A:
Q: The frequency distribution was obtained using a class width of 0.5 for data on cigarette tax rates. ...
A:
Q: The covariance of two perfectly correlated variables X and Y is 96. Determine ox and Oy if it is kno...
A:
Q: A researcher wants to know if a person would likely follow the smoking behavior of his/her father. A...
A: Any assumption about the parameter or probability function is known as Hypothesis testing. For the G...
Q: e) The main benefit of an observational study is we can determine causation between two variables. f...
A: For each of the given statements, we have to justify whether the statement is true or false and alse...
Q: Standard error is useful for answering questions such as: a. Is the estimator biased? b. Are there ...
A: Standard error
Q: Construct a boxplot for the data
A: arrange the data in ascending order data in ascending order is: 41.0, 45.0, 46.0, 53.0, 57.0, ...
Q: Say we have a model Y = Bo+ BiXr+ɛ %3D And the estimated equation is? = B, + B,X1. How do we define ...
A: Given: The model is given as y=βo+β1x1+ε this is a simple linear regression model and estimated equa...
Q: The President of the Farmers Association wants to know how the amount of fertilizer and the amount o...
A: 1. In this case, the dependent variable is Growth and the independent variables are Water and Fertil...
Q: find an example of a multivariate linear model. Cite it, illustrate it, and briefly explain what the...
A: Suppose that a manager wants to identify the impact of price and advertisement on the sales of good....
Q: 2. The principal of a high school wants to know how long his students spend doing homework at night ...
A: Since you have posted a question with multiple subparts we will solve first three subparts for you. ...
Q: The probability that a statistics graduate from a Canadian university gets a data science job is 0.6...
A: Given that Number of trials n=10 Success of probability p=0.6 X~Binomial ( n,p) Probability mass fu...
Q: selected at random. Define the random variable X as the number of defective cameras in the sample. W...
A:
Q: Let X be a discrete random variable with probability mass function P(X= x) = p(1 −p); x= 0,1,2,.... ...
A: Here, the given probability mass function seems to be incorrect. So, we correct it as p(1 −p)^x; x= ...
Q: You flip a fair coin 5 times and record 1 if heads and -1 if tails. Let r be the sum of the realized...
A:
Q: WHat could be an added description for the following data set? DATA SET A company institutes an ...
A: Given that, Sample size = 10 workers µd = Population mean score difference before and after In orde...
Q: The frequency distribution was obtained using a class width of 0.5 for data on cigarette tax rates. ...
A: Frequency distribution of cigarettes tax rate. We have to find out population mean and population st...
Q: Suppose a convenience store averages 450 customers per day entering the store with a standard deviat...
A: Let X be a random variable following normal distribution with mean μ and variance σ2, i.e., X~N(μ,σ2...
Q: 3rd Data Set: 14,12,11,13,14,14,13,13,13,14,13,13,1,20 (SD=0.90)
A: Interquartile range (IQR) is the positive difference between First quartile (Q1) & third quartil...
Q: The mean and standard deviation of 200 items are found to be 60 and 20 respectively. If at the time ...
A: Coefficient of variation is calculated by dividing the standard deviation and the mean. It is used t...
Q: 4. A die is rolled 100 times with the following distribution: Humber 1 2 3 4. Observed frequency 17 ...
A: Given that A die is rolled 100 times The following table is given : Number 1 2 3 4 5 6 Obse...
Q: 6. Television station ABC wants to know the proportion of TV owners in Metro Cebu who watch the stat...
A: “Since you have asked multiple questions, we will solve the first question for you. If you want any ...
Q: According to a research report, 65% of the adults in the U.S. support more restrictive gun control m...
A:
Q: 1,400 were for Graduation and the rest for Post-Graduation (P.G.). Out of 1,400 Graduate students 10...
A:
Q: Question 9 The systolic blood pressure of adults in the USA is nearly normally distributed with a me...
A:
Q: The following two-by-two table was created from the data. TROUBLE STAYING ASLEEP [outcome] TR...
A: Given that TP = true positive cases = 65 FP = false positive cases = 40 TN = true negative cases = 1...
Q: A delivery truck travels from point A to point B and back using the same route each day. There are f...
A: a. P(x1 + x2 = 4 ) = P(0,4) + P(1,3) + P(2,2) + P(3,1) + P(4,0) = 0.01+0.03+0.15+0.07+0.01 P(x...
Q: What is the probability of getting either a three or a four on at least one the two dice?
A: We know that S={ (1,1) (1,2) (1,3) (1,4) (1,5) (1,6) (2,1) (2,2) (2,3) (2,4) (2,5) (2,6) (3,1) (3...
Q: Is it okay if I ask for a step-by-step for a question with multiple parts? I don't want the answers,...
A: Given Information:- n Mean Median Std.Dev Min Q1 Q3 Max Listing price 1000 342,365 318,0...
Q: A random sample of 5000 taxpayers was selected and the amount of their 2018 tax refund was recorded....
A:
Q: (a) What are the null and alternate hypotheses? 0.001 0.010 (b) Suppose the P-value is approximately...
A: ANOVA(parametric test) and Kruskal Wallis (non parametric test) both are used to compare the average...
Q: What is moving average? What are its uses in analysis of time series? Given the numbers 2, 6, 1, 5, ...
A:
Q: Find the missing information in the following table : A B Combined Number 10 8 24 Mean 20 15 Geometr...
A:
Q: Give five different numbers whose mean is 11 and range is 14.
A: Here use basic formula of mean and range
Q: 2. Monica is currently teaching basic mathematics at a university. She wants to know if there is a d...
A: Given information: Students Multiple choice Problem solving Fill in the blanks 1 65 45 55 ...
Q: Please do STEP 2 only. STEPS IN THE SAMPLING PROCESS: Define the population from which the sample ...
A: 2. A pop. frame is a list of units in the target pop..
Q: The body temperatures of a group of healthy adults have a bell-shaped distribution with a mean of 98...
A: As per guideline expert have to answer first question only dear student please upload other question...
Q: Country Population Size Number of Eggs Consumed Number of Cattle Area United States 325 millio...
A: Calculate the simple difference and percenrage............
Q: A jar contains 7 pennies, 7 nickels and 2 dimes. A child selects 2 coins at random without replaceme...
A: Jar contains : 7 pennies, 7 nickels and 2 dimes Child selects 2 coins at random We have to answer fo...
Q: 1. Suppose that the number of wildfires in a season is Poison distributed. We assume that the prior ...
A: Given Number of wildfires in a season is Poisson distributed with the prior distribution of paramete...
Q: X Question 22 Customers are used to evaluate preliminary product designs. In the past, 95% of highly...
A:
Q: Choosing portable grill displays. A study of how people attempt to influence the choices of others b...
A: Given The data is as follows: Grill Display Combination Number of Students 1-2-3 35 1-2-4 8 ...
Q: x < 0 0 < x < 1 F (x) 3x 2 1
A: Let x be the Continuous random variable having cumulative distribution function F(x)
Q: Calculate the seasona! indices by the 'ratio to moving average' method from the fotnowing data. Year...
A:
Q: Using the standard normal distribution, find the two z-scores that that form the middle shaded regio...
A: In question, We have given area of a shaded region of normal curve. Then we'll find the positive and...

Step by step
Solved in 2 steps with 2 images

- Suppose now that that Y denotes the annual salaries (in thousands of dollars) for US citizenswho are in their 40s and 50; and X is an indicator (dummy) variable: X = 1 if that workergraduated from college and X=0 otherwise. Suppose the average annual salary for this age groupis $45,000 and the estimate for β is β~ = 15 with s.e. = 5.a. What is the t-statistic and associated p-value for the null hypothesis that attending collegehas no impact on subsequent salary?b. What is the upper and lower bound of a 95-percent confidence interval for β~ ?c. In a credible research design attending college would be randomly assigned to a largesample of potential students. Propose such a research design. What are the potential ethicalissues?2.Areal estate company wants to study the relationship between Home price (in OMR 1000) and the following variables: Floor size (in 100 square feet) (X,). Type of Heating (X, 1. if electricity and X, =0, if Gas), Location of home (X= 1. if in town and X, = 0, if in village). Use this to answer the following questions: Then the critical value for testing Họ: Bo =0 against H Bo 0 at 5% level is A. +2.201 B. +1.812 C. 1.796 D. None E 12.228A random sample of n1 = 16 winter days in Denver gave a sample mean pollution index x1 = 43. Previous studies show that ?1 = 15. For Englewood (a suburb of Denver), a random sample of n2 = 14 winter days gave a sample mean pollution index of x2 = 37. Previous studies show that ?2 = 17. Assume the pollution index is normally distributed in both Englewood and Denver. Do these data indicate that the mean population pollution index of Englewood is different (either way) from that of Denver in the winter? Use a 1% level of significance. (a) What is the level of significance? State the null and alternate hypotheses. H0: ?1 < ?2; H1: ?1 = ?2H0: ?1 = ?2; H1: ?1 > ?2 H0: ?1 = ?2; H1: ?1 ≠ ?2H0: ?1 = ?2; H1: ?1 < ?2 (b) What sampling distribution will you use? What assumptions are you making? The standard normal. We assume that both population distributions are approximately normal with unknown standard deviations.The standard normal. We assume that both population…
- Suppose μ1 and μ2 are true mean stopping distances at 50 mph for cars of a certain type equipped with two different types of braking systems. The data follows: m = 8, x = 114.6, s1 = 5.03, n = 8, y = 129.3, and s2 = 5.38. Calculate a 95% CI for the difference between true average stopping distances for cars equipped with system 1 and cars equipped with system 2. (Round your answers to two decimal places.) ,2- An expert estimates that the distribution parameter for durability times of parts produced with machine A in the factory is different from the distribution parameter for durability times of parts produced with machine B. Durability times of 4 parts produced from machine A and 4 parts produced from machine B are given below. Find the Mann-Whitney U value by using these data. a) 18 B) 6 NS) 16 D) 20 TO) 12A random sample of n1 = 12 winter days in Denver gave a sample mean pollution index x1 = 43. Previous studies show that ?1 = 15. For Englewood (a suburb of Denver), a random sample of n2 = 16 winter days gave a sample mean pollution index of x2 = 37. Previous studies show that ?2 = 11. Assume the pollution index is normally distributed in both Englewood and Denver. Do these data indicate that the mean population pollution index of Englewood is different (either way) from that of Denver in the winter? Use a 1% level of significance. What is the value of the sample test statistic? (Test the difference ?1 − ?2. Round your answer to two decimal places.)=__ (c)Find (or estimate) the P-value. (Round your answer to four decimal places.=__
- A random sample of n1 = 14 winter days in Denver gave a sample mean pollution index x1 = 43. Previous studies show that ?1 = 13. For Englewood (a suburb of Denver), a random sample of n2 = 10 winter days gave a sample mean pollution index of x2 = 35. Previous studies show that ?2 = 11. Assume the pollution index is normally distributed in both Englewood and Denver. Do these data indicate that the mean population pollution index of Englewood is different (either way) from that of Denver in the winter? Use a 1% level of significance. what is the sample test statistic find or estimate p valueA random sample of n1 = 20 winter days in Denver gave a sample mean pollution index x1 = 43. Previous studies show that ?1 = 11. For Englewood (a suburb of Denver), a random sample of n2 = 18 winter days gave a sample mean pollution index of x2 = 36. Previous studies show that ?2 = 15. Assume the pollution index is normally distributed in both Englewood and Denver. Do these data indicate that the mean population pollution index of Englewood is different (either way) from that of Denver in the winter? Use a 1% level of significance. a) What is the value of the sample test statistic? (Test the difference ?1 − ?2. Round your answer to two decimal places.)b) Find (or estimate) the P-value. (Round your answer to four decimal places.)12/20 Compute the linear correlation coefficient between the weight of a car and its miles per gallon. R =_. Round to three decimal places as needed.
- 2. Find the mean and variance of the r.v. X if it has p.m.f. P(X=1)=0.2 , P(X=2)=0.3 and P(X=3) = 0.5 ? 3. In a large class, on exam 1, the mean and standard deviation of scores were 78 and 20, respectively, for exam 2, the mean and standard dervationwere 72 and 15, respectively. The covariance of the exam scroes was 80. Give the mean and standard deviation of the sum of the two exam scores. Assume all students took both exams.A dietitian wishes to see if a person’s cholesterol level will be changed if the diet is supplemented by a certain mineral. Four subjects were pre-tested, and they took the mineral supplement for a 6-week period. The results are shown in the table. Is there sufficient evidence to conclude that the population mean of cholesterol levels has been changed after six weeks at α=0.2α=0.2? Assume that the differences are from an approximately normally distributed population. Subject Cholestrol Level (mg/dl) Cholestrol Level after 6 Weeks (mg/dl) dd ¯dd¯ (d−¯d)2(d-d¯)2 1 206 217 11 2 219 184 -35 3 202 204 2 4 213 205 -8 Total -30 a) Calculate the mean, the sum of the squared deviation from the mean, and the standard deviation of differences. Do not include the unit for each answer: ¯d=d¯= (do not round) ∑(d−¯d)2=∑(d-d¯)2= (do not round) sd=sd= (rounded to one decimal place) b) Perform the hypothesis test in the following steps: Step 1.…A random sample of n1 = 20 winter days in Denver gave a sample mean pollution index x1 = 43. Previous studies show that σ1 = 11. For Englewood (a suburb of Denver), a random sample of n2 = 15 winter days gave a sample mean pollution index of x2 = 49. Previous studies show that σ2 = 16. Assume the pollution index is normally distributed in both Englewood and Denver. Do these data indicate that the mean population pollution index of Englewood is different (either way) from that of Denver in the winter? Use a 1% level of significance. (a) What is the level of significance? What is the value of the sample test statistic? (Test the difference μ1 − μ2. Round your answer to two decimal places.)(c) Find (or estimate) the P-value. (Round your answer to four decimal places.)