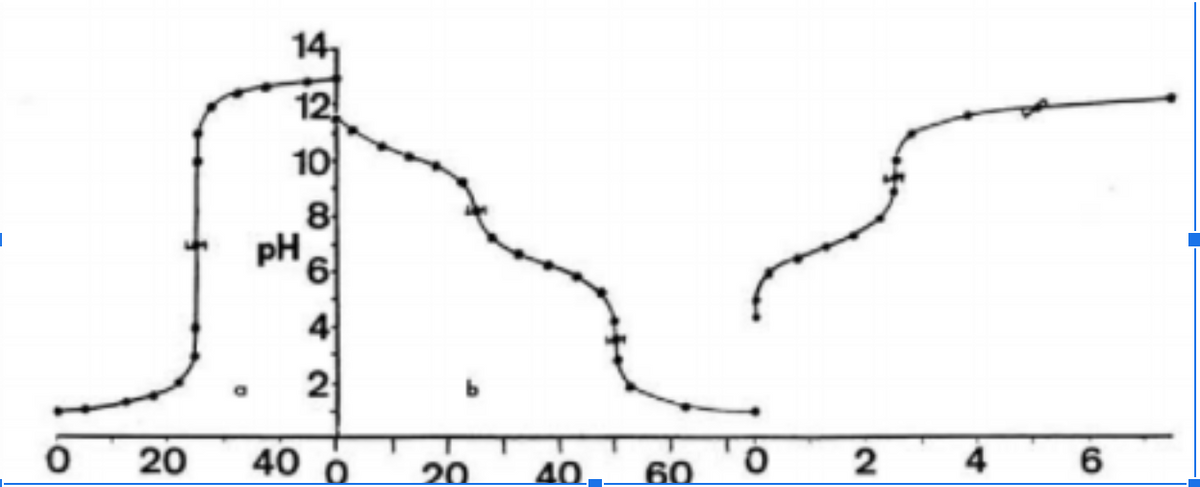
Consider the following 3 separate titration curves in the following figure. These curves are generated by three different titrations with different reagents, but they are shown in the same figure for simplicity. Now look at the following titrations (not in any particular order): 0.1M Na2CO3 with 0.1M HCl 0.1M HCl with 0.1M NaOH 0.01M H2S with 0.1M NaOH a) Match the curves with the correct reagents. b) Label the buffer regions
Consider the following 3 separate titration curves in the following figure. These curves are generated by three different titrations with different reagents, but they are shown in the same figure for simplicity. Now look at the following titrations (not in any particular order): 0.1M Na2CO3 with 0.1M HCl 0.1M HCl with 0.1M NaOH 0.01M H2S with 0.1M NaOH a) Match the curves with the correct reagents. b) Label the buffer regions
Introductory Chemistry: A Foundation
9th Edition
ISBN:9781337399425
Author:Steven S. Zumdahl, Donald J. DeCoste
Publisher:Steven S. Zumdahl, Donald J. DeCoste
Chapter2: Measurements And Calculations
Section: Chapter Questions
Problem 132AP: The length 500 m can also be expressed as nm.
Related questions
Question
Consider the following 3 separate titration curves in the following figure. These curves are generated by three different titrations with different reagents, but they are shown in the same figure for simplicity.
Now look at the following titrations (not in any particular order):
0.1M Na2CO3 with 0.1M HCl
0.1M HCl with 0.1M NaOH
0.01M H2S with 0.1M NaOH
- a) Match the curves with the correct reagents.
- b) Label the buffer regions
- c) Label the equivalence points, and the pKa points.

Transcribed Image Text:14
12
10
8
PH
4
2
20
40 0
40. 60
4
6
20
Expert Solution
This question has been solved!
Explore an expertly crafted, step-by-step solution for a thorough understanding of key concepts.
Step by step
Solved in 2 steps with 1 images

Knowledge Booster
Learn more about
Need a deep-dive on the concept behind this application? Look no further. Learn more about this topic, chemistry and related others by exploring similar questions and additional content below.Recommended textbooks for you

Introductory Chemistry: A Foundation
Chemistry
ISBN:
9781337399425
Author:
Steven S. Zumdahl, Donald J. DeCoste
Publisher:
Cengage Learning

Introductory Chemistry: A Foundation
Chemistry
ISBN:
9781337399425
Author:
Steven S. Zumdahl, Donald J. DeCoste
Publisher:
Cengage Learning