Consider the following data: 1 1.6 2.9 3. 4.1 4.4 5.8 6.5 7.1 7.2 7.5 y 3. 3.3 4 4.1 4.8 5.4 5.6 5.9 5.2 4.9 4.7 4.3 a) Create a scatterplot, print, and attach to the worksheet. b) Clearly, this data is not linear. Guess how this scatter plot suggests that the data should be transformed. 75
Consider the following data: 1 1.6 2.9 3. 4.1 4.4 5.8 6.5 7.1 7.2 7.5 y 3. 3.3 4 4.1 4.8 5.4 5.6 5.9 5.2 4.9 4.7 4.3 a) Create a scatterplot, print, and attach to the worksheet. b) Clearly, this data is not linear. Guess how this scatter plot suggests that the data should be transformed. 75

Linear Algebra: A Modern Introduction
4th Edition
ISBN:9781285463247
Author:David Poole
Publisher:David Poole
Chapter7: Distance And Approximation
Section7.3: Least Squares Approximation
Problem 31EQ

Related questions
Topic Video
Question
please dont use excel to sovle this problem
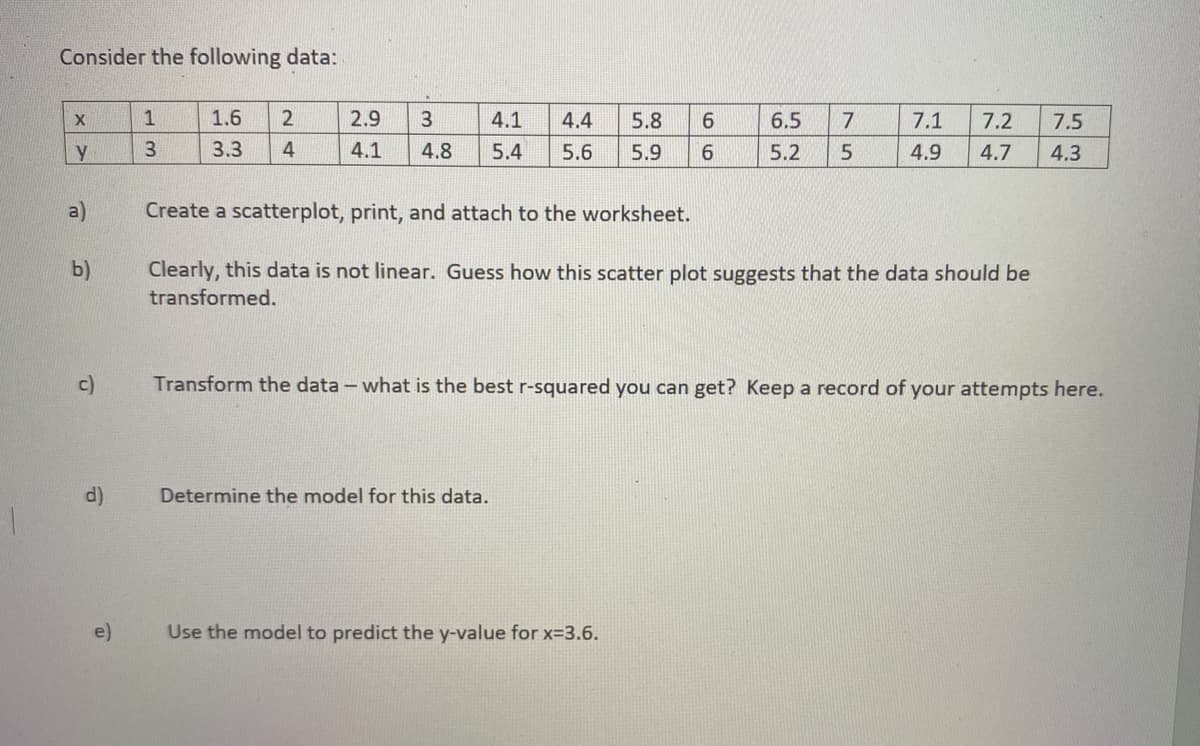
Transcribed Image Text:Consider the following data:
X
1
1.6
2
2.9
4.1
4.4
5.8
6.5
7
7.1
7.2
7.5
3.3
4
4.1
4.8
5.4
5.6
5.9
6.
5.2
4.9
4.7
4.3
a)
Create a scatterplot, print, and attach to the worksheet.
b)
Clearly, this data is not linear. Guess how this scatter plot suggests that the data should be
transformed.
c)
Transform the data - what is the best r-squared you can get? Keep a record of your attempts here.
d)
Determine the model for this data.
e)
Use the model to predict the y-value for x-3.6.
Expert Solution
This question has been solved!
Explore an expertly crafted, step-by-step solution for a thorough understanding of key concepts.

Step by step
Solved in 8 steps with 1 images

Knowledge Booster


Learn more about
Need a deep-dive on the concept behind this application? Look no further. Learn more about this topic, statistics and related others by exploring similar questions and additional content below.Recommended textbooks for you
Linear Algebra: A Modern Introduction
Algebra
ISBN:
9781285463247
Author:
David Poole
Publisher:
Cengage Learning

Big Ideas Math A Bridge To Success Algebra 1: Stu…
Algebra
ISBN:
9781680331141
Author:
HOUGHTON MIFFLIN HARCOURT
Publisher:
Houghton Mifflin Harcourt

Holt Mcdougal Larson Pre-algebra: Student Edition…
Algebra
ISBN:
9780547587776
Author:
HOLT MCDOUGAL
Publisher:
HOLT MCDOUGAL
Linear Algebra: A Modern Introduction
Algebra
ISBN:
9781285463247
Author:
David Poole
Publisher:
Cengage Learning
Big Ideas Math A Bridge To Success Algebra 1: Stu…
Algebra
ISBN:
9781680331141
Author:
HOUGHTON MIFFLIN HARCOURT
Publisher:
Houghton Mifflin Harcourt
Holt Mcdougal Larson Pre-algebra: Student Edition…
Algebra
ISBN:
9780547587776
Author:
HOLT MCDOUGAL
Publisher:
HOLT MCDOUGAL