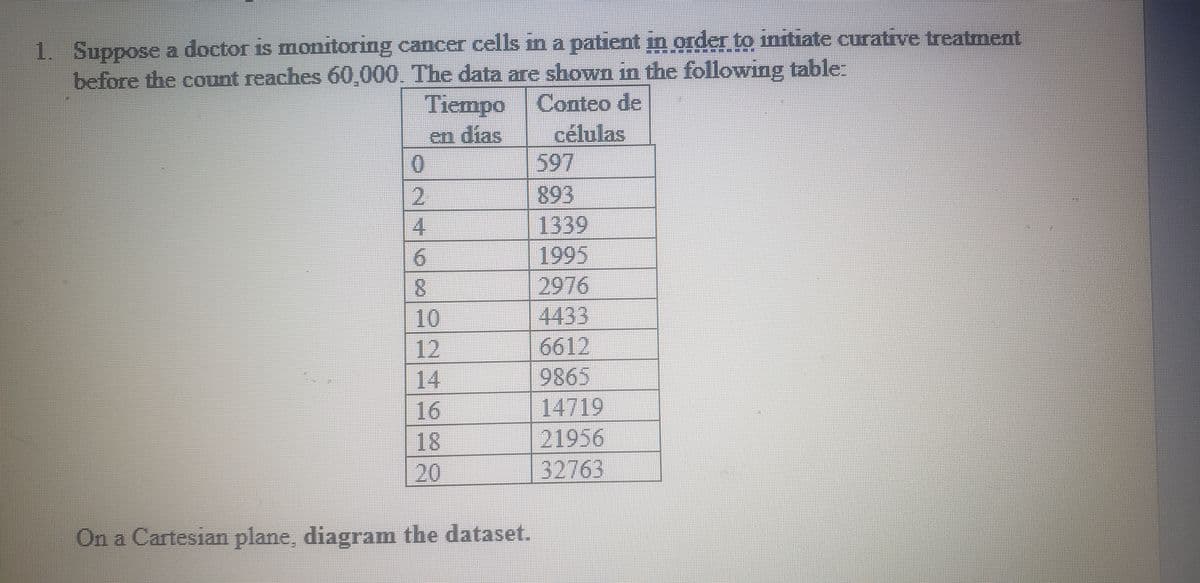
Suppose a doctor is monitoring cancer cells in a patient in order to initiate curative treatment before the count reaches 60,000. The data are shown in the following table: Tiempo Conteo de en días células 597 2 893 4. 1339 6. 1995 2976 10 4433 12 6612 14 9865 16 14719 18 21956 20 32763 On a Cartesian plane, diagram the dataset.
Q: The following table gives the total number of people fully vaccinated in Oklahoma over a window of…
A: Note:- Since you have posted a question with multiple sub-parts, we will solve first three sub-…
Q: The table below contains the height in centimeters for10 sets of adult women twins. Calculate the…
A: The given table shows the height in centimeters for 10 sets of adult women twins.
Q: The accompanying table gives the number of men 65 years or older in the United States and the…
A: Given the data
Q: Select a scatter plot of the given data. 4% 6% 8% 10% 12% 14% t 28.01 18.85 14.27 11.53 9.69 8.38 90…
A: Table of data is given. The aim is to select the correct scatter plot.
Q: The following table presents the daily high temperatures for the city of Macon, Georgia, in degrees…
A: Stem and leaf plot. The stems are listed in the left side of the vertical line and these numbers…
Q: Use the given data set to complete parts (a) through (c) below. (Use a = 0.05.) 10 8 13 9 11 14 6 4…
A:
Q: How strongly do physical characteristics of sisters and brothers correlate? Provided are data on the…
A: Given Information: Brother (X) 71 68 66 67 70 71 70 73 72 65 66 70 Sister (Y) 69 64 65 63 65 62…
Q: I have a statistics the question which on the attached image.
A: The five number summary of the data includes first, second and, third quartiles, minimum and maximum…
Q: The manager of a fleet of automobiles is testing two brands of radial tires. He assigns one tire of…
A: Given : Brand 1 Brand 2 34900 36700 45500 47200 37100 37700 32000 31400 48900 47800…
Q: Student grades on a chemistry exam were: 77; 78; 76; 81; 89; 52; 79; 82; 84; 91 Select the…
A: (1) Identify the correct stem plot for the given data. The correct option for the stem plot is…
Q: Calculate the coefficient of skewness from the following data: Mid-point : 15 20 25 30 35 40…
A:
Q: The following data give the number of defective motors received in 20 different shipments. 8 12 10…
A: Dot plot: Steps for construction Dot plot: Consider the range 0 to 35 on X-axis. Keep one dot…
Q: Students in a large lecture class want to know who has, on average, more Facebook friends, male or…
A: Answer and solution is uploaded below Thanks!
Q: Given below are the figures of production (in thousand mounds) of a Sugar factory : Year 2001 2002…
A:
Q: Construct a scatterplot for the given data. |-6|7| 8| 7| 12 |10|6 |-2 | 1 7) y| 2 9 12 10 11| 86 22…
A: To construct scatter diagram for the given data
Q: In the article “Evaluation of Low-Temperature Properties of HMA Mixtures”, the following values of…
A: Given that n=24
Q: 11 The manager at a theater collects the data below on the ticket price and attendance for eight…
A: Below is the Scatter plot drawn for the given question. In the Plot, X- Axis represents Ticket…
Q: The following table shows the annual family income of the students enrolled in the JRMSU-TC and…
A: Solution-: X=Annual family income (Pesos) (in '000) and Y=General weighted average (GPA) %…
Q: Student grades on a chemistry exam were: 77; 78; 72; 81; 89; 53; 79; 82; 84; 91 1. Select the…
A:
Q: A listing of calories per one ounce of selected salad dressings (not fat-free) is given below.…
A: Given that: We make a stem and leaf diagram from the given data set. Stem leaf 10…
Q: Here is a data set summarized as a stem-and-leaf plot: Stem 6 7 8 9 25 Leaf 2233468 Key: 4/5 = 45…
A: convert stem-leaf plot to row data 62,65,72,72,73,73,74,76,78,81,87,89,90,95,96,96,98
Q: The table presents gasoline mileage performance for 25 automobiles (Source: Motor Trend, 1975). Y X1…
A: Solution: Let A denote by 1 and M denoted by 0. From the given information,
Q: Great white sharks are big and hungry. Here are the lengths in feet of 44 great whites.…
A: From the given information, Sample data: { 18.916.213.219.1 12.516.715.716.2…
Q: The following is data for the first and second Quiz scores for 8 students in a class. First Quiz…
A: In this case First Quiz (Q1) is the independent variable and the Second Quiz (Q2) is the dependent…
Q: calls 55 35 25 55 55 40 35 60 75 50 40 65 Plot the table and give at least three…
A: Given:
Q: The table below shows data for the population of the United States year U.S. Population…
A:
Q: The prices of 12 different types of cereal, rounded to the nearest dollar, are shown. Make a dot of…
A: Given:The prices of 12 different types of cereal, rounded to the nearest dollar. To make a dot of…
Q: Suppose that a customer is purchasing a car. He conducts an experiment in which he puts 10 gallons…
A: Solution: Note: Hello! As you have posted more than 3 sub parts, we are answering the first 3…
Q: Given are the two sets of data on geometry first quarter test scores of two sections in grade 10:]…
A: Mean is the measure of central tendency. It is calculated by adding all the observation divided by…
Q: An article gave the data, shown in the table below, on dimensions of 27 representative food…
A: The independent variables are Minimum Width, Maximum Width, and Elongation. The dependent variable…
Q: The following data are the number of pages in 40 books on a shelf. 119; 140; 178; 190; 205; 215;…
A: sample size(n)=40the given data is already arranged in ascending order.
Q: 2 An international road transport consultant wants to see if the extent of a country's motorway…
A: Hello! As you have posted more than 3 sub parts, we are answering the first 3 sub-parts. In case…
Q: Student grades on a chemistry exam were: 77; 78; 74; 81; 88; 51; 79; 82; 84; 91 Select the…
A: 7 stem 5 leaf means 75 or 51 means 5 stem and 1 leaf
Q: Show all of your work. Write the answer in the space provided. 76 74 71 78 80 67 80 82…
A: As per our guidelines, we can answer only one question at a time. Kindly re-post the other question…
Q: The following table shows the median income, in thousands of dollars, of American families for 2003…
A: H = 52.587 x 1.035t For an exponential model: P = A x ( 1+r)t , r is called growth rate. Hence, for…
Q: Here is civilian unemployment rate 1982-1995 Civilion Unemployment rate 1982-1995 year 1982 1986…
A: The given data are: S.No. Year Unemployment Rate 1 1982 9.7 2 1984 7.5 3 1986 7.0 4 1987…
Q: The following data are the heights of 40 students in a statistics class: 59; 60; 61; 62; 62; 63; 63;…
A: Solution-: Given data:…
Q: The table presents gasoline mileage performance for 25 automobiles (Source: Motor Trend, 1975). X6 Y…
A: Solution: Let A denote by 1 and M denoted by 0. From the given information,
Q: cted salad dressings (not fat-free) is given below. 180 130 160 170 110 120 160 145 150 145 150 130…
A:
Q: The following is data for the first and second Quiz scores for 8 students in a class. First Quiz…
A: The independent variable is First Quiz. The dependent variable is Second Quiz. We have to draw the…
Q: A store manager counts the number of customers who make a purchase in his store each day. The data…
A: Introduction: To solve the problem, first arrange the data in an ascending order as follows: 7, 7,…
Q: An article gave the data, shown in the table below, on dimensions of 27 representative food…
A: Step-by-step procedure to find the regression line using Excel: In Excel sheet, enter x and y in…
Q: 1la With the aid of simple diagrams, explain the types of skewness. b Calculate the skewness for the…
A: 11 (a) Skewness Skewness is an asymmetry or distortion in a collection of data that deviates from…
Q: 4. The number of homicides reported in 1995 for the following cities is given. City New Orleans…
A: 4) A Pareto chart is a particular sort of bar graph in which the bars are arranged from the highest…
Q: The data in the accompanying stem-and-leaf plot summarizes the total deposits (in hundreds of…
A: (b) Determine the number of savings institutions had total deposits in the 30 hundred millions.…
Q: The following table presents the daily high temperatures for the city of Macon, Georgia, in degrees…
A: The provided data are in ascending order is…
Q: The following table presents the daily high temperatures for the city of Macon, Georgia, in degrees…
A: Given data in ascending order: 48, 48, 51, 51, 52, 52, 52, 53, 53, 53, 55, 56, 56, 57, 58, 58, 58,…
Q: The number of red marbles in 13 bags of marbles is given below. 12, 12, 14, 14, 15, 15, 15, 17, 17,…
A:
Correlation
Correlation defines a relationship between two independent variables. It tells the degree to which variables move in relation to each other. When two sets of data are related to each other, there is a correlation between them.
Linear Correlation
A correlation is used to determine the relationships between numerical and categorical variables. In other words, it is an indicator of how things are connected to one another. The correlation analysis is the study of how variables are related.
Regression Analysis
Regression analysis is a statistical method in which it estimates the relationship between a dependent variable and one or more independent variable. In simple terms dependent variable is called as outcome variable and independent variable is called as predictors. Regression analysis is one of the methods to find the trends in data. The independent variable used in Regression analysis is named Predictor variable. It offers data of an associated dependent variable regarding a particular outcome.
Step by step
Solved in 2 steps with 1 images
- Suppose that a customer is purchasing a car. He conducts an experiment in which he puts 10 gallons of gas in the car and drives it until it runs out of gas. He conducts this experiment 15 times on each car and records the number of miles driven. Full data set Car 1 216 243 205 242 239 297 295 172 270 251 165 310 265 316 278 Car 2 231 220 223 205 245 257 242 292 248 252 287 255 250 293 251 ..... Describe each data set, that is determine the shape, center, and spread. Sample mean for Car 1 x=__________mi / 10 gal (Type an integer or decimal rounded to one decimal place as needed.) Sample mean for Car 2 x=___________mi / 10 gal (Type an integer or decimal rounded to one decimal place as needed.) Median for Car 1 M=____________mi / 10 gal (Type an integer or decimal rounded to one decimal place as needed.) Median for Car 2 M=___________mi / 10 gal (Type…Which model—the one for parliaments or the one for ministries (or cabinets)—presented in the article has the greater explanatory power? How can you tell?Table 2 Department Mean SD CoefVar Min Q1 Median Q3 Max IQR Skewness Finance 6.052 3.874 64.01 1.630 3.393 4.585 7.500 22.860 4.107 2.00 HR 5.441 3.235 59.45 2.000 3.200 4.100 6.430 21.860 3.230 1.24 IT 5.880 3.887 66.10 0.530 3.250 4.630 6.8 24.980 3.550 2.18 Marketing 6.010 3.737 62.18 1.670 3.475 5.000 6.645 22.200 3.170 2.14 Training 6.095 3.719 61.02 1.500 3.330 5.000 7.640 20.000 4.310 2.00 CoefVar stands for coefficient of variation graph (1) The company has hired you to answer the following questions: Do you think that the salaries in the departments are skewed, justify your answer with proper measure from table (2).
- Jensen Tire & Auto is in the process of deciding whether to purchase a maintenance contract for its new computerized wheel alignment and balancing machine. Managers feel that maintenance expense is related to usage of the machine, and they have collected the following information on weekly usage of the machine (in hours) and annual maintenance expense (in hundreds of dollars) from 10 other companies that own the machine.Company Weekly Usage(hours) Annual maintenance Expense(hundreds of dollars)A 13 17.0B 10 22.0C 20 30.0D 28 37.0E 32 47.0F 17…The following observations are for two quantitative variables, x and y. Observation Observation 1 21 61 11 18 98 2 13 89 12 78 38 3 57 56 13 62 36 4 82 20 14 14 96 5 36 51 15 76 23 6 77 25 16 46 79 7 31 48 17 33 58 8 28 96 18 66 70 9 64 51 19 31 35 10 66 52 20 40 34 If your answer is "zero", enter "0". a. Develop a crosstabulation for the data, with x as the row variable and y as the column variable. For use classes of 10-29, 30-49, and so on; for y use classes of 20-39, 40-59, and so on. b. Compute the row percentages (to 1 decimal). c. Compute the column percentages (to 1 decimal).The following table presents the ages of 9 U.S. presidents and their wives on the first day of their presidencies. Name Her Age His Age George W. and Laura Bush 54 54 George and Barbara Bush 55 64 Jimmy and Rosalynn Carter 49 52 Gerald and Betty Ford 56 61 Richard and Pat Nixon 56 56 Lyndon and Lady Bird Johnson 50 55 John and Jacqueline Kennedy 31 43 Dwight and Mamie Eisenhower 56 62 Harry and Bess Truman 60 60 Construct a scatterplot of the presidents' age y versus the first ladies' ages x . Plot only the points that are not outliers. First Lady's Age (years) President's Age (years) y 5 10 15 20 25 30 35 40 45 50 55 60 65 70 x 5 10 15 20 25 30 35 40 45 50 55 60 65 70 0
- Date Day Time Region Card Type Gender Buy Category Items Ordered Total Cost High Item 6-Mar Sun Morning West AJ Female High 4 $136.97 $79.97 6-Mar Sun Morning West Other Female Medium 1 $25.55 $25.55 6-Mar Sun Afternoon West AJ Female Medium 5 $113.95 $90.47 6-Mar Sun Afternoon NorthEast Other Female Low 1 $6.82 $6.82 6-Mar Sun Afternoon West AJ Male Medium 4 $147.32 $83.21 6-Mar Sun Afternoon NorthEast Other Female Medium 5 $142.15 $50.90 7-Mar Mon Evening West Other Male Low 1 $18.65 $18.65 7-Mar Mon Evening South Other Male High 4 $178.34 $161.93 7-Mar Mon Evening West Other Male Low 2 $25.83 $15.91 8-Mar Tue Morning MidWest Other Female Low 1 $18.13 $18.13 8-Mar Tue Morning NorthEast AJ Female Medium 2 $54.52 $54.38 8-Mar Tue Afternoon South Other Male Medium 2 $61.93 $56.32 9-Mar Wed Morning NorthEast AJ Male High 3 $147.68 $96.64 9-Mar Wed Afternoon NorthEast Other Male Low 1 $27.24 $27.24 10-Mar Thu Morning West Other Female Low 3 $46.18 $44.27…1. A company needs to locate a distribution facility somewhere between the source of raw materials in Los Angeles, CA and the market for the product in Chicago, IL. Using Hoover's Transport Curves Theory and the information below, which city should the ditribution center be located in? Inbound costs Outbound costs Las Vegas, NV $ 3,000,000 $ 39,000,000 Denver, CO $ 15,000,000 $ 34,000,000 Des Moines, IA $ 22,000,000 $ 18,000,000 Rockford, IL $ 37,000,000 $ 6,000,000 A. Las Vegas, NV B. Des Moines, IA C. Rockford, IL D. Denver, CO(b) (i) Create boxplots for these two data sets (either drawn by hand or as a printout from Dataplotter or another suitable computer package). Include all the relevant information required for drawing boxplots The summary values can be displayed on the boxplots themselves or in a table to the side of the chart, as they appear in Dataplotter. (ii) Use the boxplot for radio station B to say whether the data are symmetric or skewed. If the data are skewed, then state whether they are skewed to the left or skewed to the right. What does this tell you about the spread of the data for radio station B? (iii) The advertising company tries to summarise what the boxplot for radio station A is saying. Are the following statements true or false? In each case justify your answer. (1) About one-quarter of the reporting periods for radio station A had less than 10 550 000 listeners. (2) About three-quarters of the reporting periods for radio station A had more than 10 900 000 listeners.
- In the Focus Problem at the beginning of this chapter, a study was described comparing the hatch ratios of wood duck nesting boxes. Group I nesting boxes were well separated from each other and well hidden by available brush. There were a total of 489 eggs in group I boxes, of which a field count showed about 272 hatched. Group II nesting boxes were placed in highly visible locations and grouped closely together. There were a total of 821 eggs in group II boxes, of which a field count showed about 262 hatched. (a) Find a point estimate p̂1 for p1, the proportion of eggs that hatch in group I nest box placements. (Round your answer to four decimal places.) p̂1 = Find a 95% confidence interval for p1. (Round your answers to three decimal places.) lower limitupper limit (b) Find a point estimate p̂2 for p2, the proportion of eggs that hatch in group II nest box placements. (Round your answer to four decimal places.) p̂2 = Find a 95% confidence interval for p2. (Round your…In the Focus Problem at the beginning of this chapter, a study was described comparing the hatch ratios of wood duck nesting boxes. Group I nesting boxes were well separated from each other and well hidden by available brush. There were a total of 463 eggs in group I boxes, of which a field count showed about 280 hatched. Group II nesting boxes were placed in highly visible locations and grouped closely together. There were a total of 812 eggs in group II boxes, of which a field count showed about 274 hatched. (a) Find a point estimate p̂1 for p1, the proportion of eggs that hatch in group I nest box placements. (Round your answer to three decimal places.)p̂1 = Find a 99% confidence interval for p1. (Round your answers to three decimal places.) lower limit upper limit (b) Find a point estimate p̂2 for p2, the proportion of eggs that hatch in group II nest box placements. (Round your answer to three decimal places.)p̂2 = Find a 99% confidence interval for p2. (Round…A national truck rental services has a surplus of one truck in each of the cities, 1, 2, 3, 4, 5, and 6 and a deficit of one truck in each of the cities 7,8,9,10,11 and 12.The distance (in kilometers) between the cities with a surplus and cities with deficit are displayed below:a) How should the trucks be displayed so as to minimize the total distance travelled? 1 2 3 4 5 6 7 41 72 39 52 25 51 8 22 29 49 65 81 50 9 27 39 60 51 32 32 10 45 50 48 52 37 43 11 82 40 40 60 51 30