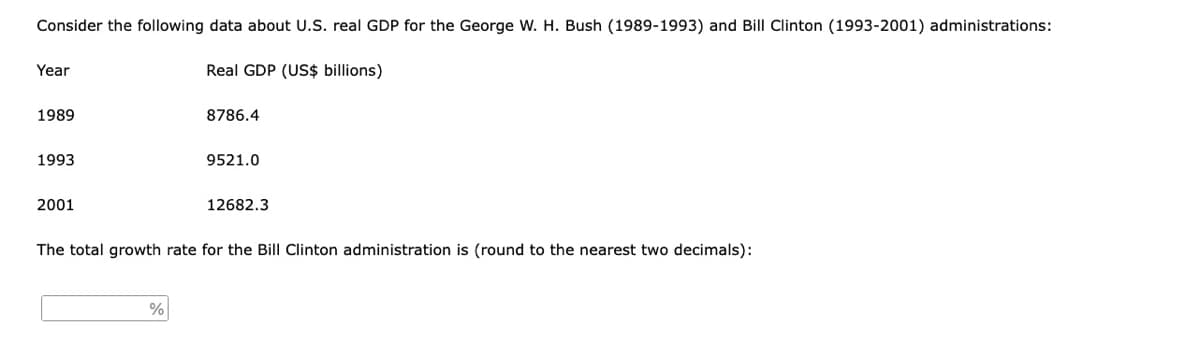
Consider the following data about U.S. real GDP for the George W. H. Bush (1989-1993) and Bill Clinton (1993-2001) administrations: Year Real GDP (US$ billions) 1989 8786.4 1993 9521.0 2001 12682.3 The total growth rate for the Bill Clinton administration is (round to the nearest two decimals):


Q: In the following scenarios, explain if demand would be affected or supply. Which curve(s) shift(s) (...
A: Here, all the given information explains different situations in the laptop market due to changes in...
Q: If an economy described by the production functionY= K has 30% of output invested in new capital and...
A: At steady state capital remain constant, that is rate of change in capital stock is zero. This impli...
Q: If the price of wireless earbuds increases, then there will be of wireless earbuds. O A. a decrease ...
A: The law of demand and the law of supply plays an important role in economics. It relates the price o...
Q: draw a general demand curve and label it D. Then shift the curve to the left or the right depending ...
A: Let the general demand curve and it is shown in the graph below
Q: The accompanying table lists the cross-price elasticities of demand for several 2. goods, where the ...
A: The cross elasticity of demand measures the change in the quantity demanded of one good following ch...
Q: A firm faces two types of consumers. Consumer A has an inverse demand of P = 120- 10 Q and consumer ...
A: Quantity Discount: It is a strategy used by sellers to entice buyers to purchase larger quantities f...
Q: Price Quantity Purchased ($) (per Day) 75 65 9 35 alculate the price elasticity of demand between $3...
A: Price elasticity represents the responsiveness of quantity demanded as a output of price change. It ...
Q: Suppose Adrienne receives a payment in cash of $400 and she deposits it in a bank. i. If the banking...
A: The entire quantity cash of cash closely-held by the general public at Any given time in an economy ...
Q: Description What accounts for differences in living standards between rich and poor countries today....
A: The number of goods or services that a certain amount of money can buy at any given time is referred...
Q: he elasticity from point A to point B seems different from the elasticity from point B to point A. F...
A: Pt A: price =$4, quantity=120 Pt B: price=$6, quantity=80 ------------------------------------------...
Q: Any help will be appreciated a. Identify each of the variables and briefly explain the meaning of ea...
A: Equilibrium is reached at the intersection of IS and LM curves. At the intersection both goods marke...
Q: Match tne explanation for why people buy more at lower prices with the proper term. Substitution eff...
A: Quantity demanded refers to the quantity of associate item or service that customers demand througho...
Q: SUGAR (Millions of pounds) Suppose that Maldonia and Lamponia agree to trade. Each country focuses i...
A: Answer: Let us first calculate the opportunity cost (OC) in the production of both the goods for bot...
Q: Suppose that each of the economy’s 600 young agents has deposits worth 100 goods with a bank no matt...
A: Hi! Thank you for the question, As per the honor code, we are allowed to answer three sub-parts at a...
Q: Explain with detail about interest rate deposit facility and lending facility
A: Answer-
Q: Troy wins a prize of a McDonald's Restaurant $10 gift certificate. He can trade the prize in for a m...
A: Opportunity cost is the cost that a person sacrifices when they choose one option over another. This...
Q: Deficit spending" refers to a situation where the government: A. Spends borrowed funds B. Collects ...
A: When tax revenue collected by the government is equal to government spending the situation is known ...
Q: Using the dynamic aggregate demand and aggregate supply model, illustrate and explain the impact of ...
A: Unemployment occurs in economics when people are out of work while actively looking for work. The un...
Q: Assume an economy with a coal producer and a steel producer. In a giver ons of coal, selling for $5 ...
A: Given that The coal producer pays $50 million wages and steel producer pays $40 million wages, hen...
Q: Consider a repeated game with two players and two rounds. The stage game is shown below. Assume the ...
A: There are two players : Player 1 & 2 Strategy set of both the players : { L , M , H } Discount ...
Q: Lia wishes to have $3000 after 3 years in an account that draws 6% nominal interest compounded month...
A: In this question we have to find out the principal value with the help of the above information.
Q: Egypt exports of soaps, lubricants, and waxes, to Kenya was US$22.63 Million during 2019,according t...
A: Introduction: A franchise (or franchising) could be a technique of distributing products or services...
Q: Refer to the table below for a very simple economy producing three goods: movies, burgers and bikes....
A: GDP is the sum of total market value of goods and services which is produced domestically during in ...
Q: Which concept is NOT illustrated by the production possibilities frontier? A. tradeoffs B. effi...
A: The production possibility frontier (PPF) is a bend that represents the potential amounts that can b...
Q: If the Wall Street Journal published an article w/ the headline "Poultry Farmers Detect Infectious A...
A: The demand curve of a product depicts the quantity demanded of the product at each level of price, k...
Q: Graphs of the revenue and cost functions are shown below. Answer the following questions. (x), C(x) ...
A: (i) The total cost curve is straight line in nature The total revenue curve is parabola in nature. ...
Q: Question 9 If Tony Stark provides consulting services to a firm in Sweden, this is then counted as a...
A: Balance of payment is the account which records the monetary transaction occurred between the nation...
Q: Marginal cost equals A) all the opportunity cost of producing the amount of output. B) the opportuni...
A: Marginal cost is calculated by differentiating total cost or total variable cost with respect to out...
Q: An increase in the quantity of hybrid cars supplied would be caused by which of the following? A. A...
A: Demand curve shows the combinations of quantity demanded at different prices. Supply curve shows com...
Q: 3. As marginal cost rises, average variable cost necessarily rises. * True False
A: Marginal cost (MC) curve is the incremental cost of production, i.e. the cost incurred when one more...
Q: Discuss the role and function of any large financial institution in your country as well as THREE im...
A: Since you have asked multiple question, we will solve the first question for you. If you want any sp...
Q: 12 of 15 Which one of the following statements regarding the price-setting curve is true? O If labou...
A: The curve for determining prices Curve for determining prices When enterprises set their profit-maxi...
Q: Explain why Applied Economics is not a field of economics. If Applied Economics is not field of econ...
A: A brief overview Economics generally only covers how things are produced, consumed and distributed. ...
Q: Please draw a demand curve. Label everything possible.
A: A demand curve is a graph that depicts the relationship between the price of a commodity and the qua...
Q: vices 44,133 Primary income receipts 36,063 Imports of goods 132,484 Import of services 29,443 Prima...
A: Balance on goods = Exports of goods – Imports = 107941 – 132484 = -24543 Balance of services = Expo...
Q: The marginal cost function of a company is given by MC 5+x, and the cost of producing 2 umits is 712...
A: Fixed costs are costs that do not change when sales or production volumes increase or decrease.Fixed...
Q: Assume in a small island economy (without connection to other economies) just four goods are produce...
A: (a) Nominal GDP = Current year price * Current year quantity => Nominal GDP = (Current year price...
Q: In the rural area of a large agricultural-based economy in which corn is the staple food, there are ...
A: Farmer is the producer and their products price are determined by the market demand and supply at ...
Q: Consider the following table that gives the monthly per capita consumption expenditure of 10 househo...
A: Option A is correct Poverty Gap is the aggregate measure of depth of poverty below the poverty lin...
Q: Consider a simple economy that produces only three products: hot dogs, torches and golf balls. Use t...
A: since you have asked multiple questions and according to our policy we can only solve the first part...
Q: What are the key elements of the scientifific method and how does this method relate to economic pri...
A: We can say that the methodology used by economists to determine economic laws or values is the scien...
Q: Assume that the government sets a price floor in the market for wheat and the price floor is set bel...
A: Despite the market being in equilibrium, it can sometime lead in exploitation of consumers or produc...
Q: Consider a Japanese firm that sells product Y in the local market and contemplates sales to the US. ...
A: Since we answer a maximum of 3 sub-parts, 1-c will be answered here. Please re-upload the question m...
Q: Why is technical writing vital in our everyday lives?
A: Technical writing is written to educate, instruct, or lead someone on how to do a task.
Q: Consider two oligopolistic firms (Firm 1 and Firm 2) in a price-setting duopoly. Both firms have no ...
A: profit maximization is the short run or long run process by which a firm may determine the price, i...
Q: Janet deposited $12,000 in her savings account on June 15, 2018. The savings account earns her 2.50%...
A: Given information, Present value (P): $12,000 Interest rate (r): 2.50% Time period (t): 0.37 (134/3...
Q: John consumes 20 units of food and 24 units of clothing. If food is an inferior good, will John be i...
A: Inferior good is the one whose demand declines with increase in income.
Q: On the basis of the three individual demand schedules below, and assuming these three people are the...
A: Market demand schedule for a private good is the horizontal summation of individual demand curves. T...
Q: The first graph presents the utility maximizing combinations of bread and brie that Hayden chooses w...
A: Given: Price of bread=$1 per loaf The price of brie could either be: $4 or $6 per wheel
Q: urrent Account Value Exports of goods 107,941 Exports of services 44,133 Primary income receipts 36,...
A: The statistical discrepancy is the amount by which the total of current, capital, and financial acco...
Real GDP is a macroeconomic measure of the value of economic output that has been adjusted for price changes. This adjustment converts nominal GDP, a money-value measure, into an index of total output quantity. Real GDP is an inflation-adjusted measure that reflects the value of all goods and services produced by an economy in a given year (expressed in base-year prices).

Trending now
This is a popular solution!

Step by step
Solved in 2 steps


- Consider the following data on U.S. GDP: Year Nominal GDP GDP Deflator (Billions of dollars) (Base year 2009) 2016 18,707 105.93 1996 8,073 73.18 The growth rate of nominal GDP between 1996 and 2016 was , and the growth rate of the GDP deflator between 1996 and 2016 was . (Hint: The growth rate of a variable XX over an NN-year period is calculated as 100×((XfinalXinitial)(1N)−1)100×XfinalXinitial1N−1) Measured in 2009 prices, real GDP was billion in 1996 and billion in 2016. (Note: Select the answers closest to the values you compute.) The growth rate of real GDP between 1996 and 2016 was . The growth rate of nominal GDP between 1996 and 2016 was than the growth rate of real GDP.You are going to compare and contrast the GDP of the United States to that of another country of your choice for the last 3 years. Your report in narrative format should address the following questions: Describe the current GDP growth rate of the two countries. Which component of the GDP of the two countries changed the most for the last 3 years? Identify the possible causes of the changes. Describe the biggest component of the GDP of the two countries. What recommendations would you make in order to boost the GDP of the two countries?Consider the following data on the Pakistan economy:Nominal GDP GDP Deflator Year (in billions of rupees) (base year 2012)2018 21,501 111.4 1998 9,163 76.3 i. What was the growth rate of nominal GDP between 1998 and 2018? (Hint: The growth rate of a variable X over an N-year period is calculated as [(Xfinal/Xinitial)1/N – 1] x 100). ii. What was the growth rate of the GDP deflator between 1998 and 2018? iii. What was real GDP in 1998 measured in 2012 prices? iv. What was real GDP in 2018 measured in 2012 prices? v. What was the growth rate of real GDP between 1998 and 2018? vi. Was the growth rate of nominal GDP higher or lower than the growth rate of real GDP? Explain.
- Consider the following data on the Pakistan economy: Nominal GDP GDP Deflator Year (in billions of rupees) (base year 2012) 2018 21,501 111.4 1998 9,163 76.3 What was the growth rate of nominal GDP between 1998 and 2018? (Hint: The growth rate of a variable X over an N-year period is calculated as [(Xfinal/Xinitial)1/N – 1] x 100). What was the growth rate of the GDP deflator between 1998 and 2018? What was real GDP in 1998 measured in 2012 prices? What was real GDP in 2018 measured in 2012 prices? What was the growth rate of real GDP between 1998 and 2018? Was the growth rate of nominal GDP higher or lower than the growth rate of real GDP? Explain.This year, if two million new babies were born in the U.S. and if two million more immigrants came to the U.S., then the Annual Real GDP Per Capita will go down if we assume no change in the real GDP figure between this year and last year.Richland’s real GDP per person is $10,000 and Poorland’s real GDP per person is $5,000. However Richland is growing at 1% per year and Poorland is growing at 3% per year. Compare real GDP per person after 20 years and after 40 years. Please enter your answers as numerical responses rounded to the nearest dollar, and do not type out your answer as words. (ie. $13,452 not "Thirteen thousand four hundred fifty-two dollars"). What is Richland's Real GDP after 20 years? What is Richland's Real GDP after 40 years? What is Poorland's Real GDP after 20 years? What is Poorland's Real GDP after 40 years?
- How large will Canada’s GDP be in 25 years? The answer depends on what the rate of growth in GDP will be over that 25-year period. A mathematical formula we can use for this calculation is the following: GDP2041 = GDP2016 (1 + g)25 where GDP2041 is the level of GDP in the year 2041, GDP2016 is the level of GDP in the year 2016, and g is the rate of growth in GDP. Assume that GDP in 2016 is $1000 million and assume that the value of g is 0.035 (3.5 percent per year). What will be the value of GDP in 2041? Now suppose that the value of g is 0.040 (4.0 percent per year). What will be the value of GDP in 2041 given this slightly larger rate of growth? What does this result say about the importance of policies that promote even slightly faster rates of growth in GDP?Imagine the GDP per capita of a country doubles every one hundred years. What would the shape of a linear-scale graph and a ratio-scale graph be? Select one or more: a. Linear scale: an upward-sloping curve with increasing slope (called convex shape) Ratio scale: an upward-sloping straight line b. Linear scale: an upward-sloping straight line Ratio scale: a straight horizontal line c. Linear scale: an upward-sloping straight line Ratio scale: an upward-sloping curve with decreasing slope (called concave shape) d. Linear scale: an upward-sloping convex curve Ratio scale: an upward-sloping convex curveThe following table shows Spain’s (annualized) quarterly real GDP growth rates for the 2007–2012 period. (Roman numbers refer to quarters.) a) Plot real GDP growth rate in a graph, and identify a trend in the data. b) Based on the data shown, identify the beginning (i.e., the year and the quarter) of the current recession.
- Economic growth around the world The following table reports real income per person for several different economies in the years 1960 and 2010. It also gives each economy's average annual growth rate during this period. For example, real income per person in Niger was $945 in 1960, and it actually declined to $570 by 2010. Niger's average annual growth rate during this period was -1.01%, and it was the poorest economy in the table in the year 2010. The real income-per-person figures are denominated in U.S. dollars with a base year of 2005. The following exercises will help you to understand the different growth experiences of these economies. Economy Real Income per Person in 1960 Real Income per Person in 2010 Annual Growth Rate (Dollars) (Dollars) (Percent) Canada 12,946 35,810 2.06 United Kingdom 11,884 32,034 2.00 Korea 1,610 28,702 5.93 Hong Kong 4,518 44,070 4.66 Guatemala 1,985 3,859 1.34 Niger 945 570 -1.01 Indicate which economy…Calculate the quarter-over-quarter percentage change in GDP for the last four quarters: Quarter-Year GDP (Billions USD) % GDP Growth Q4-2020 5,267 -- Q1-2021 5,301 Q2-2021 5,398 Q3-2021 5,718 Q4-2021 6,104Consider the following data on U.S. GDP: Year Nominal GDP (in billions of dollars) GDP Deflator (base year 2009) 2014 17,419 108.3 1994 7,309 73.8 Answer the following questions. Please explain in detail of your calculation (if needed). 1. What is GDP Deflator? What does it mean when GDP Deflator in 2014 was 108.3? 2. What was the growth rate of nominal GDP between 1994 and 2014? 3. What was the growth rate of GDP Deflator between 1994 and 2014? 4. What was real GDP in 1994 and 2014 measured in 2009 prices?

