Consider the following data and corresponding weights Xi Weight 3.2 6 2.0 2.5 2 5.0 8 and compute the weighted mean. O a) 6.50 O b) 5.21 ) c) 3.69 d) None of the answers are correct e) 4.20
Consider the following data and corresponding weights Xi Weight 3.2 6 2.0 2.5 2 5.0 8 and compute the weighted mean. O a) 6.50 O b) 5.21 ) c) 3.69 d) None of the answers are correct e) 4.20

Glencoe Algebra 1, Student Edition, 9780079039897, 0079039898, 2018
18th Edition
ISBN:9780079039897
Author:Carter
Publisher:Carter
Chapter10: Statistics
Section10.5: Comparing Sets Of Data
Problem 13PPS

Related questions
Question
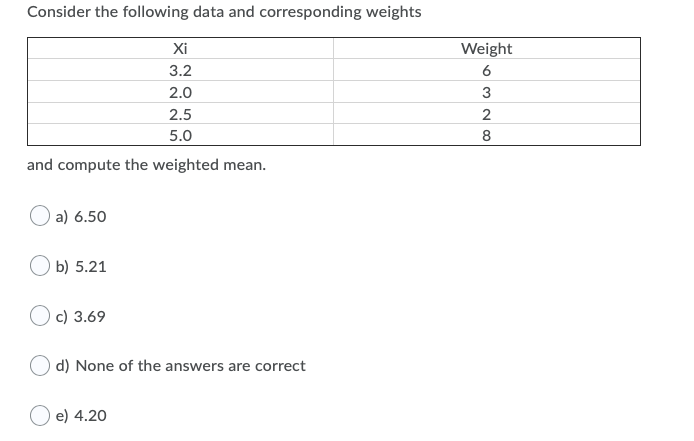
Transcribed Image Text:Consider the following data and corresponding weights
Xi
Weight
3.2
6
2.0
2.5
2
5.0
8
and compute the weighted mean.
O a) 6.50
O b) 5.21
c) 3.69
d) None of the answers are correct
e) 4.20
Expert Solution
This question has been solved!
Explore an expertly crafted, step-by-step solution for a thorough understanding of key concepts.

This is a popular solution!

Trending now
This is a popular solution!

Step by step
Solved in 2 steps with 2 images

Recommended textbooks for you
Glencoe Algebra 1, Student Edition, 9780079039897…
Algebra
ISBN:
9780079039897
Author:
Carter
Publisher:
McGraw Hill
Glencoe Algebra 1, Student Edition, 9780079039897…
Algebra
ISBN:
9780079039897
Author:
Carter
Publisher:
McGraw Hill