Consider the following data for a dependent variable y and two independent variables, ₁ and 2; for these data SST = 15,224.4, and SSR = 14,052.5. x1 У 94 109 Round your answers to three decimal places. a. Compute R² . b. Compute R. 30 47 24 51 41 51 75 36 59 76 X2 13 11 18 16 5 20 8 13 13 16 112 179 94 176 170 118 143 211 c. Does the estimated regression equation explain a large amount of the variability in the data? - Select your answer - ✓ Explain. Hint: If R is greater than 70%, the model explains a large amount of variability. Since the adjusted coefficient of determination is - Select your answer than 70%, the model - Select your answer-explain a large amount of variability.
Consider the following data for a dependent variable y and two independent variables, ₁ and 2; for these data SST = 15,224.4, and SSR = 14,052.5. x1 У 94 109 Round your answers to three decimal places. a. Compute R² . b. Compute R. 30 47 24 51 41 51 75 36 59 76 X2 13 11 18 16 5 20 8 13 13 16 112 179 94 176 170 118 143 211 c. Does the estimated regression equation explain a large amount of the variability in the data? - Select your answer - ✓ Explain. Hint: If R is greater than 70%, the model explains a large amount of variability. Since the adjusted coefficient of determination is - Select your answer than 70%, the model - Select your answer-explain a large amount of variability.

MATLAB: An Introduction with Applications
6th Edition
ISBN:9781119256830
Author:Amos Gilat
Publisher:Amos Gilat
Chapter1: Starting With Matlab
Section: Chapter Questions
Problem 1P

Related questions
Question
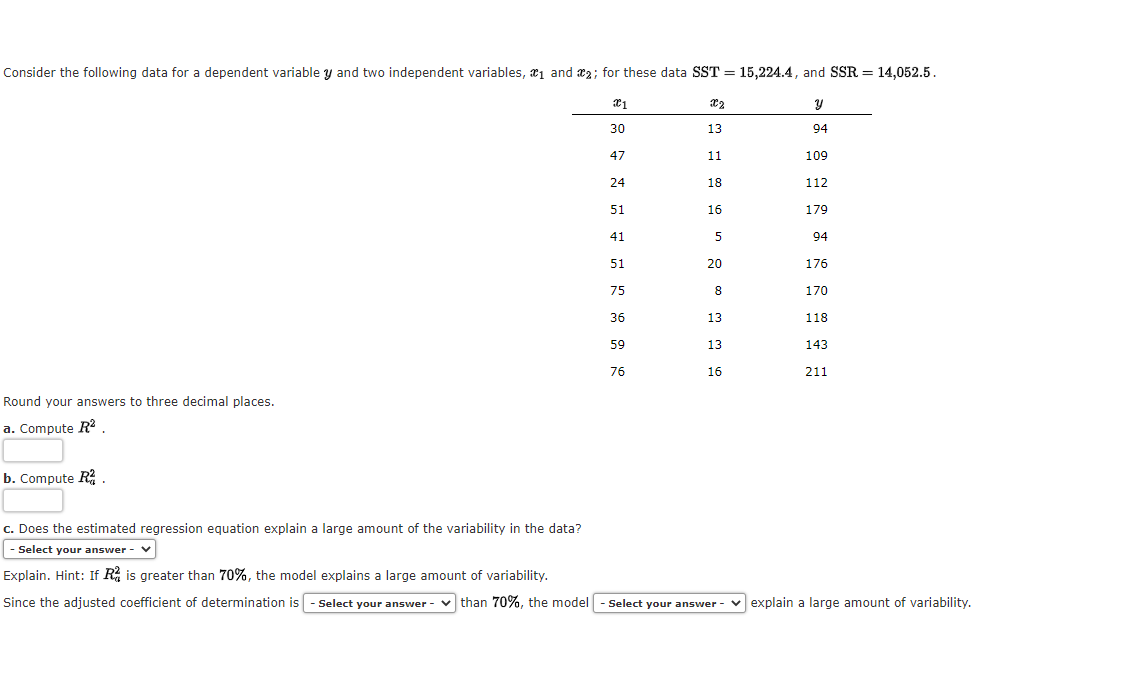
Transcribed Image Text:Consider the following data for a dependent variable y and two independent variables, ₁ and 2; for these data SST = 15,224.4, and SSR = 14,052.5.
x1
y
94
Round your answers to three decimal places.
a. Compute R².
b. Compute R².
30
47
24
51
41
51
75
36
59
76
X2
13
11
18
16
5
20
8
13
13
16
109
112
179
94
176
170
118
143
211
c. Does the estimated regression equation explain a large amount of the variability in the data?
- Select your answer - V
Explain. Hint: If R is greater than 70%, the model explains a large amount of variability.
Since the adjusted coefficient of determination is - Select your answer than 70%, the model - Select your answer-explain a large amount of variability.
Expert Solution
This question has been solved!
Explore an expertly crafted, step-by-step solution for a thorough understanding of key concepts.

Step by step
Solved in 2 steps with 1 images

Recommended textbooks for you
MATLAB: An Introduction with Applications
Statistics
ISBN:
9781119256830
Author:
Amos Gilat
Publisher:
John Wiley & Sons Inc

Probability and Statistics for Engineering and th…
Statistics
ISBN:
9781305251809
Author:
Jay L. Devore
Publisher:
Cengage Learning

Statistics for The Behavioral Sciences (MindTap C…
Statistics
ISBN:
9781305504912
Author:
Frederick J Gravetter, Larry B. Wallnau
Publisher:
Cengage Learning
MATLAB: An Introduction with Applications
Statistics
ISBN:
9781119256830
Author:
Amos Gilat
Publisher:
John Wiley & Sons Inc
Probability and Statistics for Engineering and th…
Statistics
ISBN:
9781305251809
Author:
Jay L. Devore
Publisher:
Cengage Learning
Statistics for The Behavioral Sciences (MindTap C…
Statistics
ISBN:
9781305504912
Author:
Frederick J Gravetter, Larry B. Wallnau
Publisher:
Cengage Learning

Elementary Statistics: Picturing the World (7th E…
Statistics
ISBN:
9780134683416
Author:
Ron Larson, Betsy Farber
Publisher:
PEARSON

The Basic Practice of Statistics
Statistics
ISBN:
9781319042578
Author:
David S. Moore, William I. Notz, Michael A. Fligner
Publisher:
W. H. Freeman

Introduction to the Practice of Statistics
Statistics
ISBN:
9781319013387
Author:
David S. Moore, George P. McCabe, Bruce A. Craig
Publisher:
W. H. Freeman