Consider the following data set: 1, 7, 7, 2, 3, 5, 13, 17, 18, 12, 9, 15, 20, 20, 22, 25 d. Draw a Box-Whisker Plot. e. Find the Inter Quartile Range (IQR). f. Find the sample mean.
Consider the following data set: 1, 7, 7, 2, 3, 5, 13, 17, 18, 12, 9, 15, 20, 20, 22, 25 d. Draw a Box-Whisker Plot. e. Find the Inter Quartile Range (IQR). f. Find the sample mean.

Glencoe Algebra 1, Student Edition, 9780079039897, 0079039898, 2018
18th Edition
ISBN:9780079039897
Author:Carter
Publisher:Carter
Chapter10: Statistics
Section10.5: Comparing Sets Of Data
Problem 14PPS

Related questions
Question
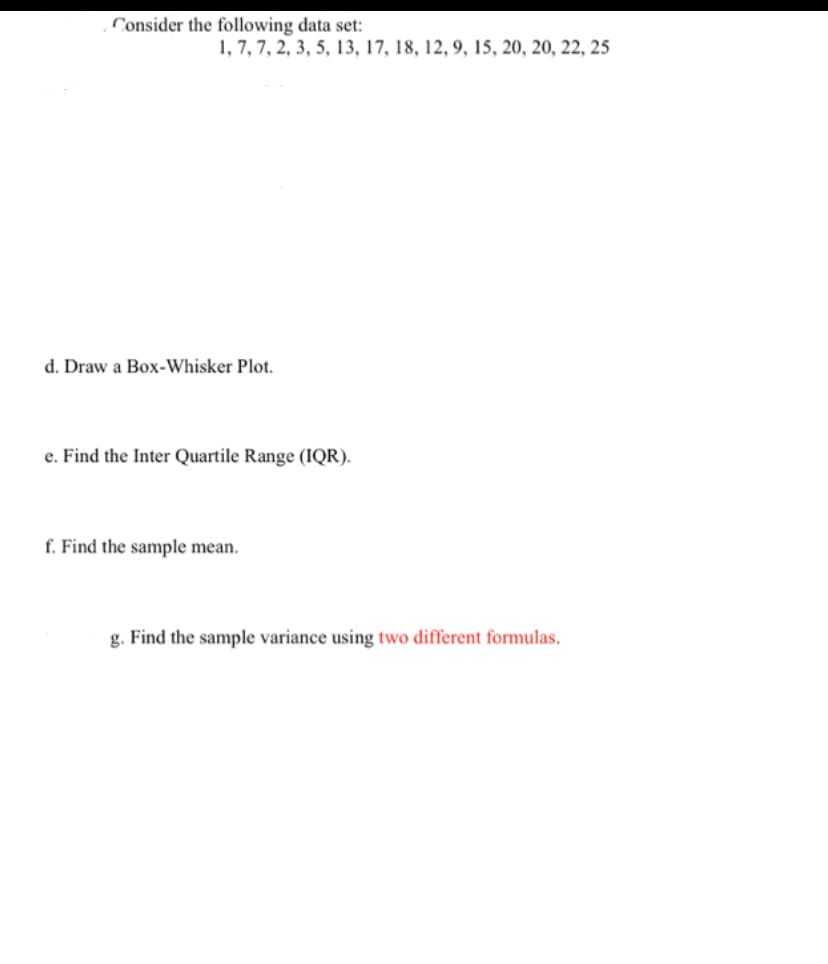
Transcribed Image Text:Consider the following data set:
1, 7, 7, 2, 3, 5, 13, 17, 18, 12, 9, 15, 20, 20, 22, 25
d. Draw a Box-Whisker Plot.
e. Find the Inter Quartile Range (IQR).
f. Find the sample mean.
g. Find the sample variance using two different formulas.
Expert Solution
Step 1
Data give 1,7,7,2,3,5,13,17,18,12,9,15,20,20,22,25
Note: According to Bartleby guidelines, expert solve only one question and maximum 3 subpart of the first question and rest can be reposted.

Step by step
Solved in 4 steps with 4 images

Recommended textbooks for you
Glencoe Algebra 1, Student Edition, 9780079039897…
Algebra
ISBN:
9780079039897
Author:
Carter
Publisher:
McGraw Hill
Glencoe Algebra 1, Student Edition, 9780079039897…
Algebra
ISBN:
9780079039897
Author:
Carter
Publisher:
McGraw Hill