

Q: Use five decimal places Fit the following data by the equation y= ax° using the Least squares method…
A: Solution : Here, we have to fit an exponential curve y=abx for given data. So we have to use the…
Q: Use the data below to determine the least squares equation using the correct formula. Hint: This is…
A:
Q: Use five decimal places Fit the following data by the equation y= ax using the Least squares method…
A: To fit the given equation, y=axb Taking logarithm on both sides.…
Q: Answer #28 - #34 using this data set: f 7 1 6 4 5 3 4 1 3 1 2 1 3 31. What is the mean of X? (SHOW…
A: Given below
Q: (a) Using the method of least square, fit a curve of the form y = a+bx to the following data…
A: We have to use the method of least square, fit a curve of the given form y = x(a + bx) to the given…
Q: let x has the p.d.f f(x) = {3xe* 3xe-V3x 0 < x < c0 0.W By m.g.f find the mean and variance of the…
A:
Q: With the following data: 2. 141 6 | 7 (x) 70 122 144 152 174 196 202 Use the least square method to…
A:
Q: Suppose that E (X1) =4 What is the Mean square Err What value of p minimizes t
A: Given: E (X1)=4, V (X1) = 6E (X2)=4, V (X1) = 8 (a) Mean square error of μ^=X13+X22: Expected value…
Q: Given the following summary information, calculate the value of the y-intercept for the least…
A:
Q: For the following data points, a) find the linear interpolation spline b) find the quadratic…
A: The data points given is as follows: x -1 0 12 1 52 y 2 1 0 1 0 (a) We are asked to…
Q: Use regression to find a quadratic model for the given data. 1 8 y 2.3 9.7 27.7 36.1 62.1
A:
Q: For the given data (0, 5), (1,9), (4, 3) find the curve y = a + byx that best fits the data in the…
A: Given the data (0, 5), (1, 9), (4, 3)
Q: Use constant differences or ratios to determine which parent function would best model the given…
A: The data set provides a set of independent values represented by and their corresponding dependent…
Q: 3 6 y |0.5 | 1.6 | 2.2 Which of the following is the coefficient a in the exponential function y =…
A:
Q: 11. Which model seems most appropriate for this scatter plot? a. linear b. quadratic c. exponential…
A:
Q: Given the following data: 10 15 20 25 30 35 Y 65.76 88.43 122 145 152.6 200.4 Find the Least Square…
A: Given data, X Y X*Y X*X 10 65.76 657.6 100 15 88.43 1326.45 225 20 122 2440 400 25 145…
Q: Examine the following two quantitative variables. Create a quadratic model to predict y using x as…
A: Solution we will solve it by using excel and the steps are Enter the Data into excel Click on Data…
Q: Q2- Find a straight line approximation for the following data, using the least square method? 8 7 1…
A:
Q: 4. Fit the following data in a second order linear interpolation polynomial. 3 У, ст 1 T, K 900 480…
A: Note: Since we only answer 1 question at a time, we'll answer the 4th one. Please resubmit the…
Q: 3 6 0.5 1.6 2.2 L.. Which of the following is the coefficient b in the exponential function y=a.e^bx…
A:
Q: 2. Please use the following data to calculate f(7) via linear, quadratic, cubic and quartic…
A: As per Bartleby's answering policy, we can answer only one question with a maximum of three…
Q: Q. 1. Fit a straight line trend by least square method from the following data : Value of X : 1 2 3…
A:
Q: Q2: From the table data below , find (Two ) of the following :- C 2-6 7- 11 12-16 17 - 21 22- 26 F…
A: Introduction- Mid point=Lowerclass limit +upper class limit 2 median =L+N2-Cffhwhere , L=Lower…
Q: Find f(3.1) based on the following data points (2.2, 25.234) ; (2.9, 11.146); (3.3, -1.647); ( 3.8,…
A: Find your answer below
Q: using the data X P (X) 0 0.12 1 0.18 2 0.30 3 0.15…
A:
Q: . The following data represents the projected global efense spending (in trillion of dollars) from…
A: 9) Given data points are, a) Excel Procedure: Enter t and defense spending in Excel>Data>Data…
Q: Examine the following two quantitative variables. Create a quadratic model to predict y using x as…
A: Using Minitab: Stat --> Regression --> Regression Click Model
Q: x02 356 y 117 11 20 Question 1 Determine the best (according to sum-of-squares-measure) curve y = ax…
A: Since you have asked multiple question, we will solve the first question for you. If youwant any…
Q: Q2: From the table data below , find (Two ) of the following :- 7-11 43 17- 21 22-26 12 - 16 65 2-6…
A:
Q: The following data is given: x023 5 6 y| 11 7 11 20
A:
Q: Consider the following data. x 2 2.2 2.4 2.6 f 9.0 8.4 7.8 7.2 (a) Test the data to see…
A: a) To check whether the given data is linear or not.
Q: Find the maximum value of y, by using data given below : 1 2 4 y 0-25 2-25 16
A:
Q: For a data set {xi, yi ; i=1,n}, which of the following conditions must be satisfied by an…
A:
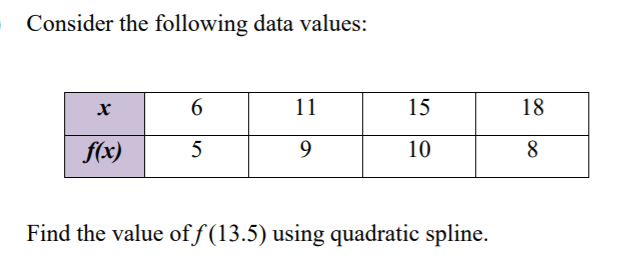
Q: (b) Consider the following data values: 8 11 15 18 f(x) 9 10 8 Find the value of f (12.5) using…
A: To find the value of f12.5: General quadratic spline function is, fx=ax2+bx+c -----(1) Substitute…
Q: Use the method of least squares to calculate the slope and intercept, and their respective…
A: Consider the given table. x y 2 1 4 2 5 3 7 4 Thr formula of least square to find the…
Q: The following regression was derived from data collected from 1568 individuals: Yi= 2500i +147Xi –…
A: We have the following information about a certain regression equation: Yi= 2500 +147Xi – 23 Xi2…
Q: A recent study showed that the hours a person exercised in a week affected the individual'sresting…
A: From the given information r=-0.68 it is the correlation between two variables. So, the percentage…
Q: or (165) (46) (7) R2 = 0.87 F-value is significant at 5% level (a) Given the above equation which…
A:
Q: With the given data points below, use every method in Polynomial Approximation and Interpolation to…
A: Given x f(x) 3.5 0.285714 3.6 0.277778 3.7 0.270270 3.8 0.263158
Q: 8. Find Q.D. and its coefficient from the following data. Class 130- 134 150- 154 155- 160- 164 5…
A:
Q: Test the following data table to see whether the data are quadratic. x 0 4 16 32 44 y 4 12…
A: We have to find the first differences and second differences from the given data.
Q: 1. By the method of least squares, find the straight line that best fits the following data: I| 2 3…
A:
Q: For the following data points X 1 2 4 y 1 4 a. find the linear interpolation spline b. find the…
A: we have, x0=0, x1=1,x2=2,x3=3,x4=4 and y0=3,y1=1,y2=2,y3=4,y4=2 a Linear Interpolation Spline: The…
Q: Use five decimal places Fit the following data by the equation y= ах using the Least b+x squares…
A:
Q: 2. For each table of values, decide whether the data model a linear, quadratic, or exponential…
A:
Q: The following data is given: x02 3 5 6 y|1 1 7 11 20 Question 1 Determine the best (according to…
A:
Q: Given the following summary information, calculate the value of the y-intercept for the least…
A: The independent variable is x. The dependent variable is y. This is simple linear regression model.…
Q: Q2: From the table data below , find (Two ) of the following :- 7-11 43 2-6 19 12 - 16 65 17- 21 31…
A:
Q: x 0 2 3 5 6 y 1 1 7 11 20 Determine the best (according to sum-of-squares-measure) curve y…
A: The data is, x 0 2 3 5 6 y 1 1 7 11 20

Step by step
Solved in 2 steps


- Use the following equation to prove that : If we multiply the data values by a constant (say, c), this will not affect the geometric mean. And give an example.Determine the best (according to sum-of-squares-measure) curve y = ax2 + bx + c, throughthe data above.A researcher collects data that represents the average number of hours of sleep in the last two nights by 8 depressed patients and 9 non-depressed patients. The researcher is interested in whether the two groups reliably differ in the amount of sleep they get. Use Jamovi to calculate t-obt and the p value.
- Consider the model y=-2.45x+7.18 derived from data between x=4 and x=10. What value of x represents interpolation of the data?Is the rectangle supposed to be 3 across the x-axis or is it 2 across the x-axis? Is the multiplier for average value 1/6? 1/(m*n)Determine the best (according to sum-of-squares-measure) curve y=ax2 through the data above.
- What is the t- value associated with 19° of freedom and 5% in a tail?An analysis of production rejects resulted in the following figures: (attached) Calculate Karl Pearson’s coefficient of skewness and comment on the results.A test statistic works like a Z-score in that it measures the distance between ________________ and __________________ in terms of ____________________.