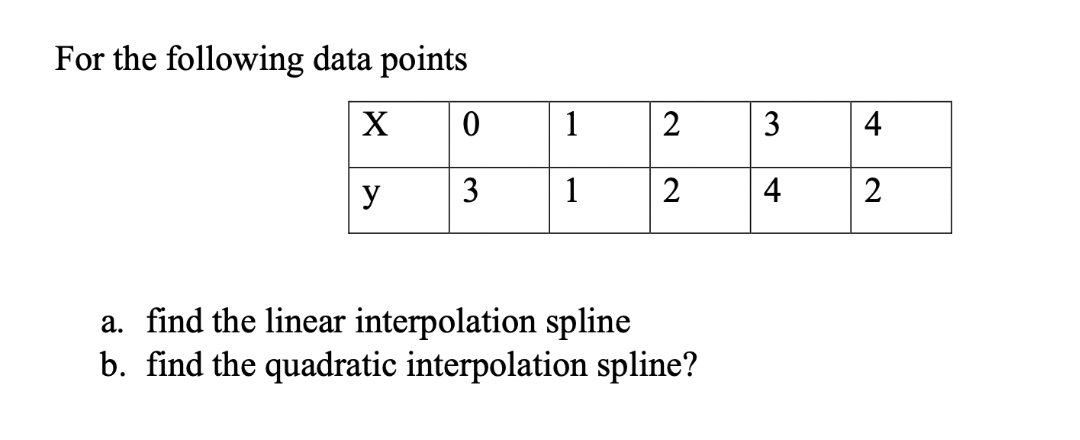
For the following data points X 1 2 4 y 1 4 a. find the linear interpolation spline b. find the quadratic interpolation spline? 3. 2. 3.


Q: . Suppose we have data points given by (z,, yn) = (0,0), (1, 2), and (2, 1). Which is the best fit…
A:
Q: Consider the following data points: r|-1 0 0 2 2 y-1 0 1 1 2 Find the best-fit line y = a+ Bx for…
A: note : As per our company guidelines we are supposed to answer ?️only the first question. Kindly…
Q: expenditure
A: Given in the following data X Y XY X2 Y2 10 7 70 100 49 20 21 420 400 441 30 23 690 900 529…
Q: I need on answer on why you would expect these pairs of observations to be dependent?
A: Here's the explanation as follows: Dependent samples can occur in two scenarios. In one, a group may…
Q: Q2) The following data represents the results of an experimental test, if the relation between…
A: The given data is x y 4 13 7 10 12 9 15 7 24 4
Q: Add the plot of f against x for the following data to the graph of y = −1.1x + 8.1. x 1 2 3 4 5 y 7…
A: Given: function is y = −1.1x + 8.1. Data table is x 1 2 3 4 5 f(x) 7 6 5 4 3
Q: Suppose that you have the following model and data to estimate the following equation Nobs Y X2 X3 1…
A:
Q: 5. Fit the following data in a linearly regressed line. Find the co-efficient of variation. x, cm 2…
A:
Q: Given the following data points, calculate the curve of best fit. Show all steps. X y -2 21 -1 8.6 1…
A: Use the given data to form the excel table: X Y X*Y X*X -2 21 -42 4 -1 8.6 -8.6 1…
Q: For a given table 1 3 6. 10 f (x) 4 7 11 15 Using linear interpolation formula, find f (5).
A: The linear interpolation formula is given by y=y1+(x-x1)y2-y1x2-x1 where, x1,y1 and (x2,y2) be two…
Q: For the following data points, a) find the linear interpolation spline b) find the quadratic…
A: The data points given is as follows: x -1 0 12 1 52 y 2 1 0 1 0 (a) We are asked to…
Q: For the data set below, use the graph to determine if 2. 3. 9.1 16.2 35.4 77.2 94 4 AYIS…
A: Given data set is
Q: Commute Times in Minutes Stem Leaves 6. 0 0 3 3 4 6 7 8 1 8 1 2 4 5 6 6 Key: minutes %3D 34
A: Given: The steam and leaf plot represents the commute times in minutes. The provided stem and leaf…
Q: Consider the following data. 21 6. 12 30 55 10.5 20.4 31.3 38.6 75.9 118.8 (a) Find a linear model.…
A: Given that the data are x 2 5 9 12 30 55 y 10.5 20.4 31.3 38.6 75.9…
Q: Given the graph of the following data points: 10 12 A = (1, -2) -2 B = (3, -3) C = (5, -4) D = (8,…
A: Statistics is a branch of mathematics that gives us the tools to deal with large quantities of data…
Q: Consider the following three dotplots. Dotplot of Brand A, Brand B, Brand C Brand A Brand B Brand C…
A: The dot plots for Brand A, Brand B and Brand C are given.
Q: From the following data find the value of Y when X-10 18 4 8. 12 Y 20 30 40 70
A:
Q: For Exercise, use the given data to find a variation model relating y to x. B х 2 12 48 2 У 0.25
A: Variation: Variation problems involves simple relationships or formulas, involving one variable…
Q: Answer the question below by clicking on the correct response. y 50 40 30 20 10- 0+ 4 8 10 12 The…
A: equation of line passing through two points ( x1 , y1) and (x2, y2) y= y1 = y2-y1x2-x1(x-x1)
Q: Given the following data: -1 1 2 y -1 1 Predict the value of y(1.5) using natural cubic spline…
A: Cubic spline formula is fi(x)=xi-x36hMi-1+x-xi-136hMi+xi-xhyi-1-h26Mi-1+x-xi-1hyi-h26Mi........(1)…
Q: For the data given below, answer parts (a) through (d). 4 6. 7 8 9. 10 y 4 6. 7 10 12 14 16 (a) Find…
A: We need to find the equation of the line containing the first and the last data points.
Q: The two data sets are dependent. Findd to the nearest tenth. X| 11.2 11.3 11.6 12.9 10.6 5) Y 11.1…
A: Given Data X Y D = X-Y 11.2 11.1 0.1 11.3 12.6 -1.3 11.6 12.9 -1.3…
Q: The following data is given: x 0 2 3 5 6 y 1 1 7 11 20 Question 1 Determine the best (according to…
A: Given data, X Y X*Y X*X 0 1 0 0 2 1 2 4 3 7 21 9 5 11 55 25 6 20 120 36
Q: find the mode for the given data x f 1 2 2 7 3 5 4 4 5 3 6 4 7 5 8 7 9 2…
A: Frequency table consist the data values along with its frequencies. Frequency table is more…
Q: Here is the data for the 8 friends reporting shoe size and ring size Friend Shoe size Ring size G…
A: Use EXCEL to construct the scatter plot. EXCEL procedure: Go to EXCEL Go to Insert menu Select…
Q: 1. Plot the scatter diagram. 2. List all six of the possible models, equations and their R2…
A: Answer: Plot the scatter diagram Here see that there is linear relationship between x and y. x…
Q: Fit a cubic spline to the following data to determine y @x =1.5 2 4 7 10 12 y 20 20 12 7 6. 6.
A:
Q: . Draw a duo-direction and deviation bar diagram for the following data: Factory X Factory Y Selling…
A: Duo-direction Bar diagram: A duo-directional bar diagram plots on both sides of X-axis. One…
Q: Consider the following data values: 6 11 15 18 f(x) 5 9 10 8 Find the value of f (13.5) using…
A: Given, x 6 11 15 18 f(x) 5 9 10 8
Q: Consider the below data set: x 75 80 93 65 87 71 98 68 84 77 y 82 78 86 72 91 80 95 72 89 74 (a)…
A: we have given the data x 75 80 93 65 87 71 98 68 84 77 y 82 78 86 72 91 80 95 72 89 74 To…
Q: Given the following information, describe the variation. 3 7 10 y 2 8 20 29 A Direct Variation…
A: Direct variation describes a simple relationship between two variables . We say y varies directly…
Q: (b) Consider the following data values: 8 11 15 18 f(x) 9 10 8 Find the value of f (12.5) using…
A: To find the value of f12.5: General quadratic spline function is, fx=ax2+bx+c -----(1) Substitute…
Q: A test of H0:ρ=0H0:ρ=0 versus Ha:ρ≠0Ha:ρ≠0 determines that there is evidence of a linear…
A: Hey there! Thank you for posting the question. Since there are multiple questions posted, we will…
Q: The two data sets are dependent. Find a to the nearest tenth. A 69 66 61 63 51 B 25 23 20 25 22 O A)…
A: Given: n = 5 Formula Used: d = ∑i=1ndin
Q: Consider the following data: 4 7 P(X = x) 0.2 0.2 0.2 0.2 0.2 %3D Step 5 of 5: Find the value of P(X…
A: We have given the following data x 4 5 6 7 8 P(X = x) 0.2 0.2 0.2 0.2 0.2 We have to find-…
Q: Consider the following table where g (x), h(x), and m(x) are
A:
Q: Develop linear splines for these data points and predict f(1.4) and f(0.29) 1.7 1.8 1.9 2.0 2.1 2.2…
A: f(1.4)=4.2934 f(0.29)=-0.07667
Q: Q3\Create the FDD table for the given data set. Use it to interpolate of consumption for year…
A:
Q: The following data was taken from experiment. The data can be modeled by the folloWIng equation. ya…
A: From the given information, the given model is,
Q: Consider the following data for two variábles. 3 4 7 89 y 4. 54 6 9 5 a. Develop an estimates…
A: x y 2 4 3 5 4 4 7 6 8 9 9 5 y = a+bx be the least squares line of y on x where y^ is…
Q: - Question 17 Which of the following lines would be the best fit for the data points plotted in the…
A:
Q: Find the quartic function that is the best fit for the data in the following table. x y -3 61 -2 9…
A: Given, x y -3 61 -2 9 -1 1 0 1 1 -3 2 1 3 49
Q: 2. A researcher measures the relationship between education (in years) and investment gains (in…
A: Given: n=4
Q: Calculate f (8)using linear interpolation formula from the following table 10 S(x) 4. 9. 16
A: Linear interpolation formula is fx=fx1+x-x1fx2-fx1x2-x1 1 Here, x1=7, x2=10,…
Q: The following data is given: x02 3 5 6 y|1 1 7 11 20 Question 1 Determine the best (according to…
A:
Q: For the following scores, Y 4 2 9 1 6 1 9 a. Sketch a scatter plot and estimate the Pearson cor-…
A: We have given that two random variables X and Y each of sample size 4.
Q: Consider the following data points, where the first coordinate corresponds to x and the second…
A: 1): missing value of y =-2/15 2): value of x at which yhat is zero =8/3
Q: For The following data, the best fit line is: X 2 Y 12 10 12 3 r will be - 0.987 r will be positive…
A: Explanation of the answer is as follows


Trending now
This is a popular solution!

Step by step
Solved in 4 steps


- Find the equation of the regression line for the following data set. x 1 2 3 y 0 3 4For the following data (0, 22), (15, 24), (18, 37), (22, 25), (24, 123) what three data points of x should you choose for quadratic interpolation to find y(14.9)?Determine the best (according to sum-of-squares-measure) curve y = ax + b, through thedata below.
- Suppose that weights of college mathematics textbooks in the United States are normally distributed with mean µ = 2.25 lbs and variance σ2 = 0.2025 lbs. Find the weight that corresponds to Q3 and interpret this measure of position in the context of the problem.The following data is given:x 0 2 3 5 6y 1 1 7 11 20Question 1 Determine the best (according to sum-of-squares-measure) curve y = ax + b, through the data above.If the value of D40 is 82, therefore, ____ of the data is less than or equal to 82.
- Each of 25 teenage girls with one brother was asked to provide her own height (y), in inches, and the height (x), in inches, of her brother. The scatterplot below displays the results. Only 22 of the 25 pairs are distinguishable because some of the (x,y) pairs were the same. The equation of the least-squares regression line is ŷ = 35.1 + 0.427x.*Girls are on the y-axis and brothers are on the x-axis* a.) Draw the least-squares regression line on the scatterplot above. b.) One brother’s height was x = 67 inches and his sister’s height was y = 61 inches. Circle the point on the scatterplot above that represents this pair and draw the segment on the scatterplot that corresponds to the residual for it. Give a numerical for the residual. c.) Suppose the point x = 84 , y = 71 is added to the data set. Would the slope of the least squares regression line increase, decrease, or remain about the same?Explain. Would the correlation increase, decrease, or remain about the same? Explain.The director of a local Tourism Authority would like to know whether a family’s annual expenditure on recreation (y), measured in $000s, is related to their annual income (x), also measured in $000s. In order to explore this potential relationship, the variables x and y were recorded for 10 randomly selected families that visited the area last year. The results were as follows: Week 1 2 3 4 5 6 7 8 9 10 x 41.2 50.1 52.0 62.0 44.5 37.7 73.5 37.5 56.7 65.2 y 2.4 2.7 2.8 8.0 3.1 2.1 12.1 2.0 3.9 8.9 The summary statistics for these data are: Sum of x data: 520.4 Sum of the squares of x data: 28431.42 Sum of y data: 48 Sum of the squares of y data: 343.74 Sum of the products of x and y data: 2858.63 (i) Draw a scatter diagram of these data.The director of a local Tourism Authority would like to know whether a family’s annual expenditure on recreation (y), measured in $000s, is related to their annual income (x), also measured in $000s. In order to explore this potential relationship, the variables x and y were recorded for 10 randomly selected families that visited the area last year. The results were as follows: Week 1 2 3 4 5 6 7 8 9 10 x 41.2 50.1 52.0 62.0 44.5 37.7 73.5 37.5 56.7 65.2 y 2.4 2.7 2.8 8.0 3.1 2.1 12.1 2.0 3.9 8.9 The summary statistics for these data are: Sum of x data: 520.4 Sum of the squares of x data: 28431.42 Sum of y data: 48 Sum of the squares of y data: 343.74 Sum of the products of x and y data: 2858.63 Calculate the sample correlation coefficient. Interpret the findings.