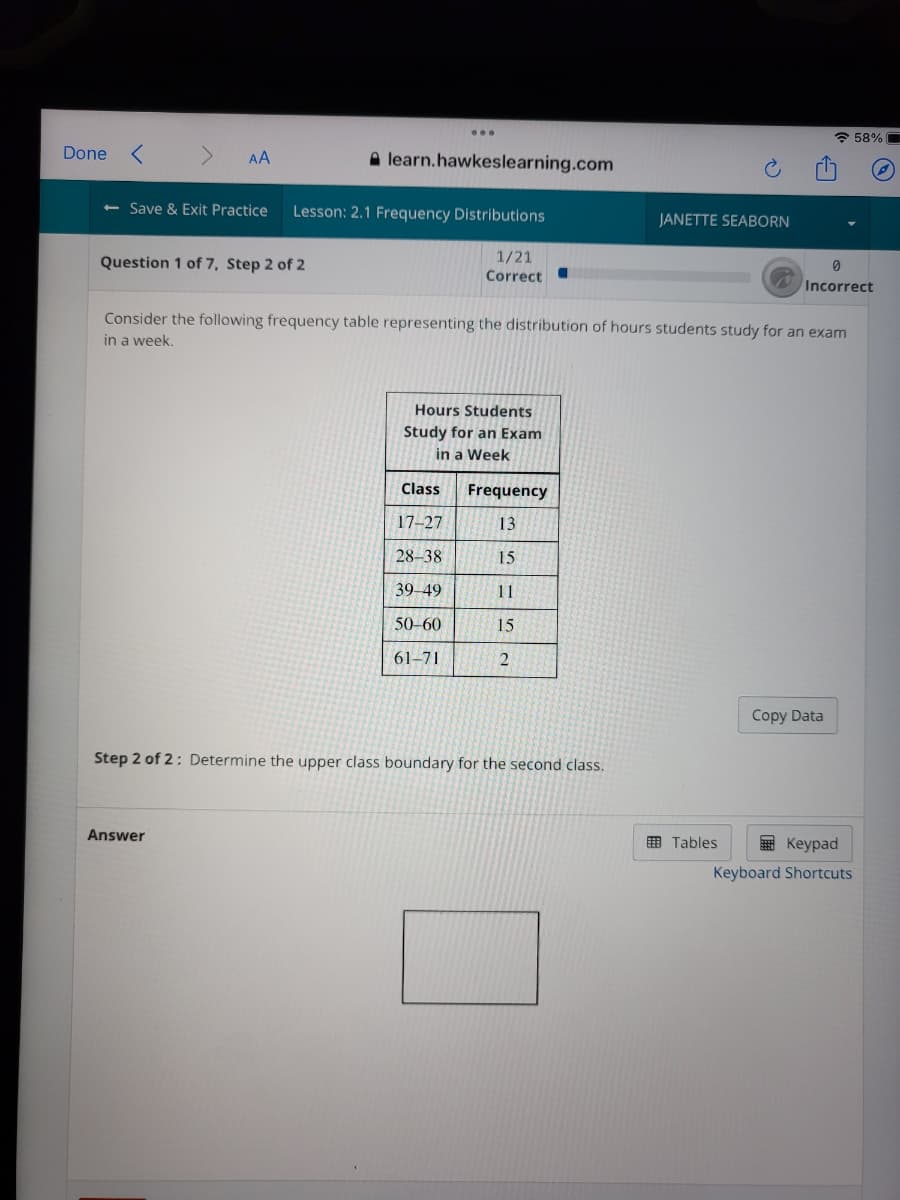
Consider the following frequency table representing the distribution of hours students study for an exam in a week. Hours Students Study for an Exam in a Week Class Frequency 17-27 13 28-38 15 39-49 11 50-60 15 61–71 21 Copy Data Step 2 of 2: Determine the upper class boundary for the second class.
Consider the following frequency table representing the distribution of hours students study for an exam in a week. Hours Students Study for an Exam in a Week Class Frequency 17-27 13 28-38 15 39-49 11 50-60 15 61–71 21 Copy Data Step 2 of 2: Determine the upper class boundary for the second class.

Glencoe Algebra 1, Student Edition, 9780079039897, 0079039898, 2018
18th Edition
ISBN:9780079039897
Author:Carter
Publisher:Carter
Chapter10: Statistics
Section10.6: Summarizing Categorical Data
Problem 42PFA

Related questions
Question
Transcribed Image Text:* 58%
Done
A learn.hawkeslearning.com
AA
<- Save & Exit Practice
Lesson: 2.1 Frequency Distributions
JANETTE SEABORN
1/21
Question 1 of 7, Step 2 of 2
Correct
Incorrect
Consider the following frequency table representing the distribution of hours students study for an exam
in a week,
Hours Students
Study for an Exam
in a Week
Class
Frequency
17-27
13
28–38
15
39-49
11
50-60
15
61-71
Copy Data
Step 2 of 2: Determine the upper class boundary for the second class.
Answer
O Tables
E Keypad
Keyboard Shortcuts
Expert Solution
This question has been solved!
Explore an expertly crafted, step-by-step solution for a thorough understanding of key concepts.

This is a popular solution!

Trending now
This is a popular solution!

Step by step
Solved in 2 steps with 1 images

Recommended textbooks for you
Glencoe Algebra 1, Student Edition, 9780079039897…
Algebra
ISBN:
9780079039897
Author:
Carter
Publisher:
McGraw Hill
Glencoe Algebra 1, Student Edition, 9780079039897…
Algebra
ISBN:
9780079039897
Author:
Carter
Publisher:
McGraw Hill