Model Summary Adjusted R Square Std. Error of the Estimate Model R Square 1 .214a .046 .043 22.7774 a. Predictors: (Constant), Have health insurance, Female, Age ANOVAª Sum of Squares Model df Mean Square F Sig. 1 Regression 25389.700 8463.233 16.313 <.001b Residual 527111.534 1016 518.811 Total 552501.235 1019 a. Dependent Variable: How would you rate managing your economic life to reduce stress and increase security (0-100)? b. Predictors: (Constant), Have health insurance, Female, Age Coefficientsa Standardized Coefficients Unstandardized Coefficients Model Std. Error Beta t Sig. 1 (Constant) 46.514 2.981 15.602 <.001 Age .186 .044 .130 4.191 <.001 Female -4.086 1.458 -.086 -2.803 .005 Have health insurance 10.474 2.488 .130 4.210 <.001 a. Dependent Variable: How would you rate managing your economic life to reduce stress and increase security (0-100)?
Model Summary Adjusted R Square Std. Error of the Estimate Model R Square 1 .214a .046 .043 22.7774 a. Predictors: (Constant), Have health insurance, Female, Age ANOVAª Sum of Squares Model df Mean Square F Sig. 1 Regression 25389.700 8463.233 16.313 <.001b Residual 527111.534 1016 518.811 Total 552501.235 1019 a. Dependent Variable: How would you rate managing your economic life to reduce stress and increase security (0-100)? b. Predictors: (Constant), Have health insurance, Female, Age Coefficientsa Standardized Coefficients Unstandardized Coefficients Model Std. Error Beta t Sig. 1 (Constant) 46.514 2.981 15.602 <.001 Age .186 .044 .130 4.191 <.001 Female -4.086 1.458 -.086 -2.803 .005 Have health insurance 10.474 2.488 .130 4.210 <.001 a. Dependent Variable: How would you rate managing your economic life to reduce stress and increase security (0-100)?

Algebra & Trigonometry with Analytic Geometry
13th Edition
ISBN:9781133382119
Author:Swokowski
Publisher:Swokowski
Chapter5: Inverse, Exponential, And Logarithmic Functions
Section5.6: Exponential And Logarithmic Equations
Problem 67E

Related questions
Question
If our desired level of significance is .05 – that is, a 95% level of confidence — then how do we interpret the regression results you’ve obtained? Specifically, please interpret the importance – in a statistical, not substantive, sense – of each of the three independent variables included in the model.
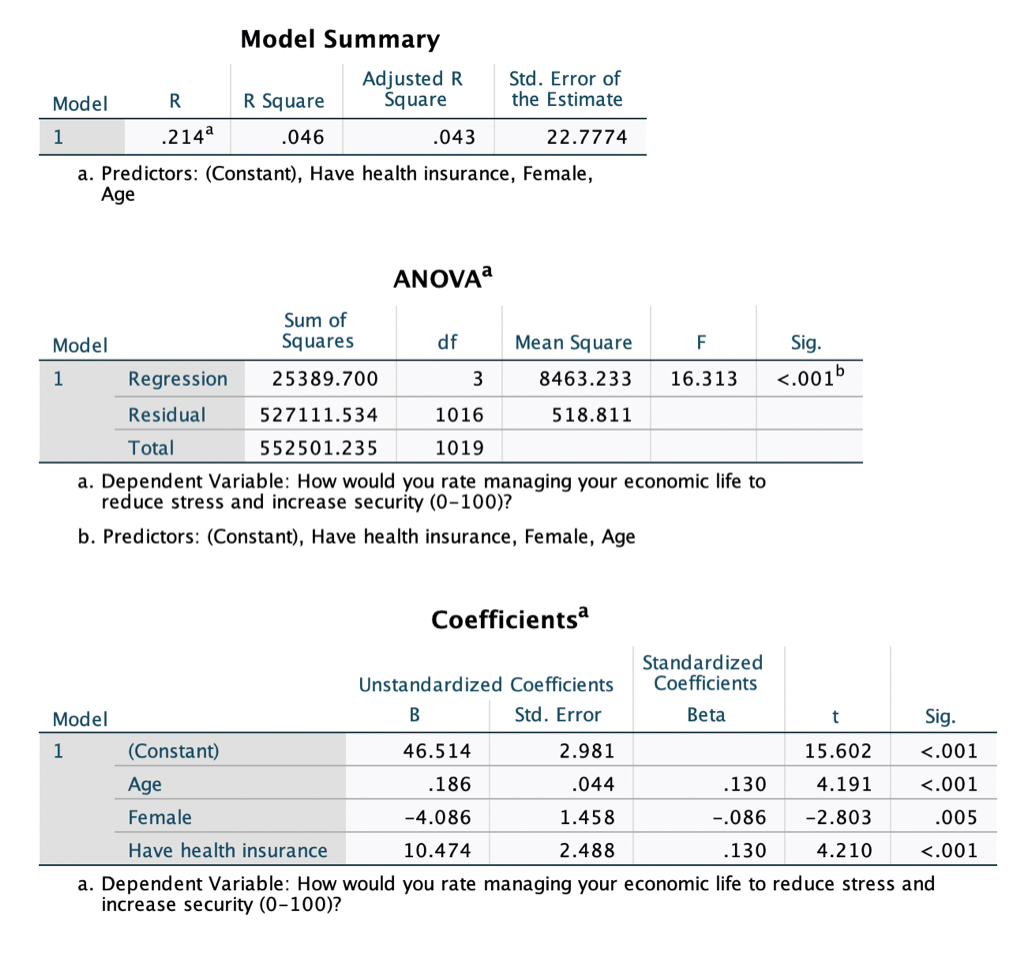
Transcribed Image Text:Model Summary
Adjusted R
Šquare
Std. Error of
the Estimate
Model
R Square
1
.214a
.046
.043
22.7774
a. Predictors: (Constant), Have health insurance, Female,
Age
ANOVAa
Sum of
Squares
Model
df
Mean Square
F
Sig.
1
Regression
25389.700
3
8463.233
16.313
<.001b
Residual
527111.534
1016
518.811
Total
552501.235
1019
a. Dependent Variable: How would you rate managing your economic life to
reduce stress and increase security (0-100)?
b. Predictors: (Constant), Have health insurance, Female, Age
Coefficientsa
Standardized
Coefficients
Unstandardized Coefficients
Model
В
Std. Error
Beta
t
Sig.
1
(Constant)
46.514
2.981
15.602
<.001
Age
.186
.044
.130
4.191
<.001
Female
-4.086
1.458
-.086
-2.803
.005
Have health insurance
10.474
2.488
.130
4.210
<.001
a. Dependent Variable: How would you rate managing your economic life to reduce stress and
increase security (0-100)?
Expert Solution
This question has been solved!
Explore an expertly crafted, step-by-step solution for a thorough understanding of key concepts.

This is a popular solution!

Trending now
This is a popular solution!

Step by step
Solved in 2 steps

Recommended textbooks for you
Algebra & Trigonometry with Analytic Geometry
Algebra
ISBN:
9781133382119
Author:
Swokowski
Publisher:
Cengage
Algebra & Trigonometry with Analytic Geometry
Algebra
ISBN:
9781133382119
Author:
Swokowski
Publisher:
Cengage