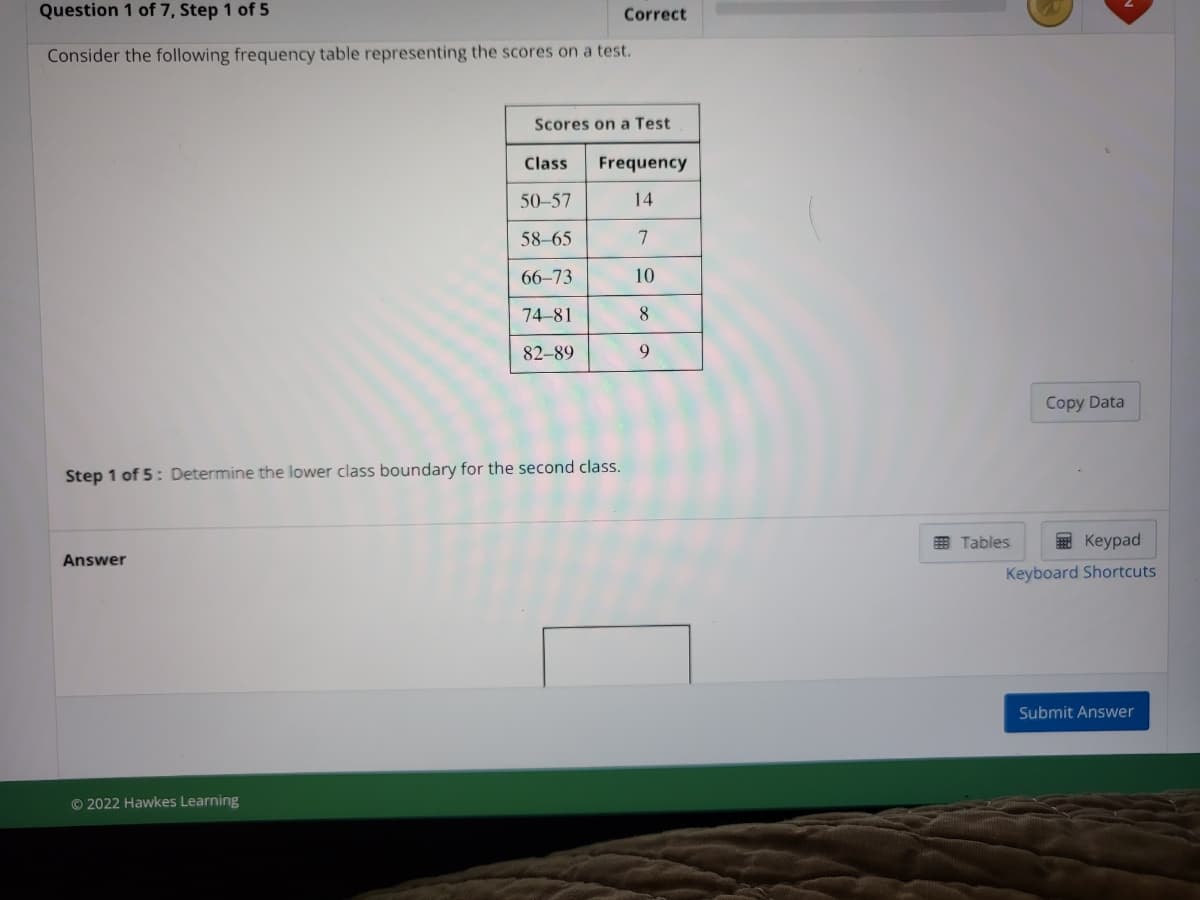
Consider the following frequency table representing the scores on a test. Scores on a Test Class Frequency 50–57 14 58-65 7 66-73 10 74-81 8 82-89 9. Step 1 of 5: Determine the lower class boundary for the second class.
Consider the following frequency table representing the scores on a test. Scores on a Test Class Frequency 50–57 14 58-65 7 66-73 10 74-81 8 82-89 9. Step 1 of 5: Determine the lower class boundary for the second class.

Glencoe Algebra 1, Student Edition, 9780079039897, 0079039898, 2018
18th Edition
ISBN:9780079039897
Author:Carter
Publisher:Carter
Chapter10: Statistics
Section10.6: Summarizing Categorical Data
Problem 4DGP

Related questions
Question
Transcribed Image Text:Question 1 of 7, Step 1 of 5
Correct
Consider the following frequency table representing the scores on a test.
Scores on a Test
Class
Frequency
50–57
14
58–65
7
66-73
10
74-81
8
82-89
9
Copy Data
Step 1 of 5: Determine the lower class boundary for the second class.
曲 Tables
Keypad
Answer
Keyboard Shortcuts
Submit Answer
© 2022 Hawkes Learning
Expert Solution
This question has been solved!
Explore an expertly crafted, step-by-step solution for a thorough understanding of key concepts.

This is a popular solution!

Trending now
This is a popular solution!

Step by step
Solved in 2 steps

Recommended textbooks for you
Glencoe Algebra 1, Student Edition, 9780079039897…
Algebra
ISBN:
9780079039897
Author:
Carter
Publisher:
McGraw Hill
Glencoe Algebra 1, Student Edition, 9780079039897…
Algebra
ISBN:
9780079039897
Author:
Carter
Publisher:
McGraw Hill