.How many degrees of freedom are there? b.What is the critical F at the .10 level c.

MATLAB: An Introduction with Applications
6th Edition
ISBN:9781119256830
Author:Amos Gilat
Publisher:Amos Gilat
Chapter1: Starting With Matlab
Section: Chapter Questions
Problem 1P

Related questions
Question
a.How many degrees of freedom are there?
b.What is the critical F at the .10 level
c.
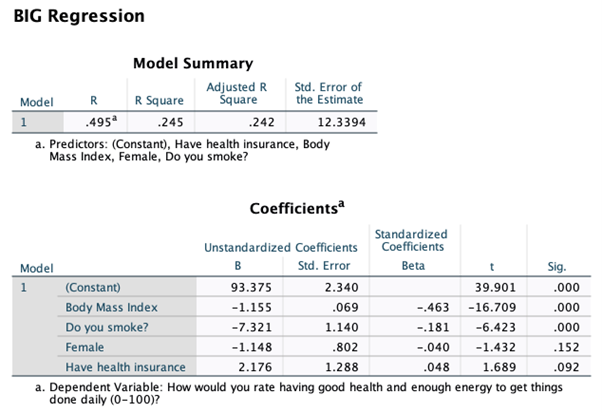
Transcribed Image Text:BIG Regression
Model Summary
Adjusted R
Square
Std. Error of
the Estimate
Model
R
R Square
1
.495*
.245
.242
12.3394
a. Predictors: (Constant), Have health insurance, Body
Mass Index, Female, Do you smoke?
Coefficients
Standardized
Coefficients
Unstandardized Coefficients
Std. Error
Beta
Model
B
Sig.
1
(Constant)
93.375
2.340
39.901
.000
Body Mass Index
-1.155
.069
-.463
-16.709
.000
Do you smoke?
-7.321
1.140
-.181
-6.423
.000
Female
-1.148
.802
-.040
-1.432
.152
Have health insurance
2.176
1.288
.048
1.689
.092
a. Dependent Variable: How would you rate having good health and enough energy to get things
done daily (0-100)?
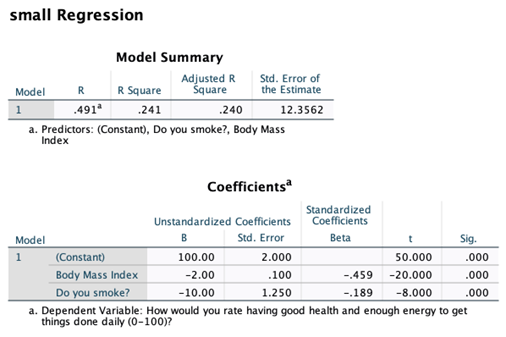
Transcribed Image Text:small Regression
Model Summary
Adjusted R
Śquare
Std. Error of
the Estimate
Model
R
R Square
.491ª
.241
.240
1
12.3562
a. Predictors: (Constant), Do you smoke?, Body Mass
Index
Coefficients
Standardized
Coefficients
Unstandardized Coefficients
Model
B
Std. Error
Beta
Sig.
1
(Constant)
100.00
2.000
50.000
.000
Body Mass Index
-2.00
.100
-.459
-20.000
.000
Do you smoke?
-10.00
1.250
-.189
-8.000
.000
a. Dependent Variable: How would you rate having good health and enough energy to get
things done daily (0-100)?
Expert Solution
This question has been solved!
Explore an expertly crafted, step-by-step solution for a thorough understanding of key concepts.

Step by step
Solved in 2 steps with 1 images

Recommended textbooks for you
MATLAB: An Introduction with Applications
Statistics
ISBN:
9781119256830
Author:
Amos Gilat
Publisher:
John Wiley & Sons Inc

Probability and Statistics for Engineering and th…
Statistics
ISBN:
9781305251809
Author:
Jay L. Devore
Publisher:
Cengage Learning

Statistics for The Behavioral Sciences (MindTap C…
Statistics
ISBN:
9781305504912
Author:
Frederick J Gravetter, Larry B. Wallnau
Publisher:
Cengage Learning
MATLAB: An Introduction with Applications
Statistics
ISBN:
9781119256830
Author:
Amos Gilat
Publisher:
John Wiley & Sons Inc
Probability and Statistics for Engineering and th…
Statistics
ISBN:
9781305251809
Author:
Jay L. Devore
Publisher:
Cengage Learning
Statistics for The Behavioral Sciences (MindTap C…
Statistics
ISBN:
9781305504912
Author:
Frederick J Gravetter, Larry B. Wallnau
Publisher:
Cengage Learning

Elementary Statistics: Picturing the World (7th E…
Statistics
ISBN:
9780134683416
Author:
Ron Larson, Betsy Farber
Publisher:
PEARSON

The Basic Practice of Statistics
Statistics
ISBN:
9781319042578
Author:
David S. Moore, William I. Notz, Michael A. Fligner
Publisher:
W. H. Freeman

Introduction to the Practice of Statistics
Statistics
ISBN:
9781319013387
Author:
David S. Moore, George P. McCabe, Bruce A. Craig
Publisher:
W. H. Freeman