Consider the following information: Probability of State of State of Rate of Return If State Occurs Economy Recession Normal Вoom Economy 20 .45 35 - 14 10 .36 Calculate the expected return. (Do not round intermediate calculations and enter your answer as a percent rounded to 2 decimal places, e.g., 32.16.)
Consider the following information: Probability of State of State of Rate of Return If State Occurs Economy Recession Normal Вoom Economy 20 .45 35 - 14 10 .36 Calculate the expected return. (Do not round intermediate calculations and enter your answer as a percent rounded to 2 decimal places, e.g., 32.16.)

Essentials of Business Analytics (MindTap Course List)
2nd Edition
ISBN:9781305627734
Author:Jeffrey D. Camm, James J. Cochran, Michael J. Fry, Jeffrey W. Ohlmann, David R. Anderson
Publisher:Jeffrey D. Camm, James J. Cochran, Michael J. Fry, Jeffrey W. Ohlmann, David R. Anderson
Chapter8: Time Series Analysis And_forecasting
Section: Chapter Questions
Problem 22P: Consider the following time series: a. Construct a time series plot. What type of pattern exists in...

Related questions
Question
Q2 week 4
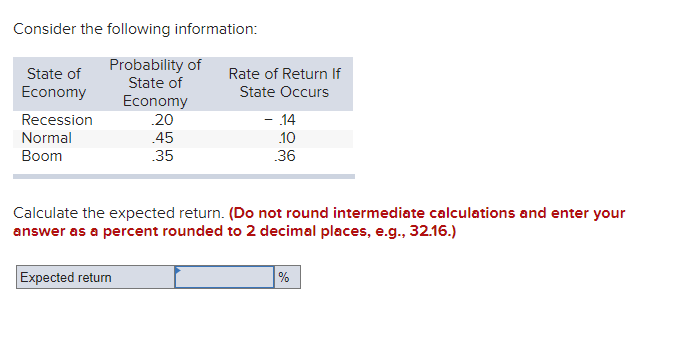
Transcribed Image Text:Consider the following information:
Probability of
State of
State of
Rate of Return If
Economy
State Occurs
Economy
Recession
20
- 14
Normal
.45
10
Вoom
35
36
Calculate the expected return. (Do not round intermediate calculations and enter your
answer as a percent rounded to 2 decimal places, e.g., 32.16.)
Expected return
%
Expert Solution
This question has been solved!
Explore an expertly crafted, step-by-step solution for a thorough understanding of key concepts.

This is a popular solution!

Trending now
This is a popular solution!

Step by step
Solved in 2 steps

Knowledge Booster


Learn more about
Need a deep-dive on the concept behind this application? Look no further. Learn more about this topic, finance and related others by exploring similar questions and additional content below.Recommended textbooks for you
Essentials of Business Analytics (MindTap Course …
Statistics
ISBN:
9781305627734
Author:
Jeffrey D. Camm, James J. Cochran, Michael J. Fry, Jeffrey W. Ohlmann, David R. Anderson
Publisher:
Cengage Learning
Essentials of Business Analytics (MindTap Course …
Statistics
ISBN:
9781305627734
Author:
Jeffrey D. Camm, James J. Cochran, Michael J. Fry, Jeffrey W. Ohlmann, David R. Anderson
Publisher:
Cengage Learning