Consider the following information: Rate of Return If State Occurs State of Probability of State of Economy Stock A Stock B Economy .15 Recession .06 - 10 Normal .56 .09 .19 Вoom .29 .14 .36 - Calculate the expected return for Stocks A and B. (Do not round intermediate calculations and enter your answers as a percent rounded to 2 decimal places, e.g., 32.16.)
Consider the following information: Rate of Return If State Occurs State of Probability of State of Economy Stock A Stock B Economy .15 Recession .06 - 10 Normal .56 .09 .19 Вoom .29 .14 .36 - Calculate the expected return for Stocks A and B. (Do not round intermediate calculations and enter your answers as a percent rounded to 2 decimal places, e.g., 32.16.)

Chapter8: Analysis Of Risk And Return
Section: Chapter Questions
Problem 1P

Related questions
Question
100%
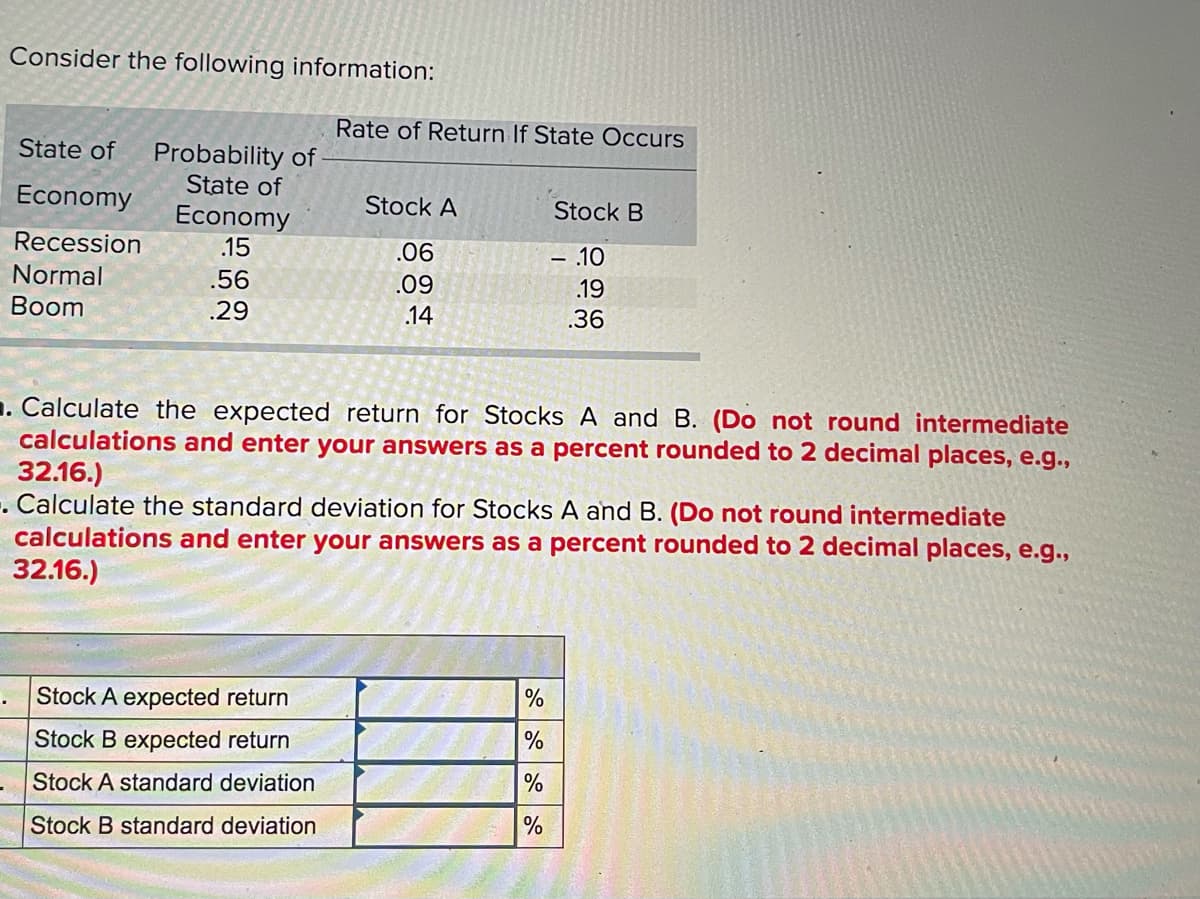
Transcribed Image Text:Consider the following information:
Rate of Return If State Occurs
State of
Probability of
State of
Economy
Stock A
Economy
Stock B
Recession
.15
.06
- 10
Normal
.56
.09
.19
Вoom
.29
.14
.36
. Calculate the expected return for Stocks A and B. (Do not round intermediate
calculations and enter your answers as a percent rounded to 2 decimal places, e.g.,
32.16.)
. Calculate the standard deviation for Stocks A and B. (Do not round intermediate
calculations and enter your answers as a percent rounded to 2 decimal places, e.g.,
32.16.)
Stock A expected return
%
Stock B expected return
%
Stock A standard deviation
%
Stock B standard deviation
%
Expert Solution
This question has been solved!
Explore an expertly crafted, step-by-step solution for a thorough understanding of key concepts.

This is a popular solution!

Trending now
This is a popular solution!

Step by step
Solved in 4 steps with 4 images

Knowledge Booster


Learn more about
Need a deep-dive on the concept behind this application? Look no further. Learn more about this topic, finance and related others by exploring similar questions and additional content below.Recommended textbooks for you
EBK CONTEMPORARY FINANCIAL MANAGEMENT
Finance
ISBN:
9781337514835
Author:
MOYER
Publisher:
CENGAGE LEARNING - CONSIGNMENT

Intermediate Financial Management (MindTap Course…
Finance
ISBN:
9781337395083
Author:
Eugene F. Brigham, Phillip R. Daves
Publisher:
Cengage Learning
EBK CONTEMPORARY FINANCIAL MANAGEMENT
Finance
ISBN:
9781337514835
Author:
MOYER
Publisher:
CENGAGE LEARNING - CONSIGNMENT
Intermediate Financial Management (MindTap Course…
Finance
ISBN:
9781337395083
Author:
Eugene F. Brigham, Phillip R. Daves
Publisher:
Cengage Learning