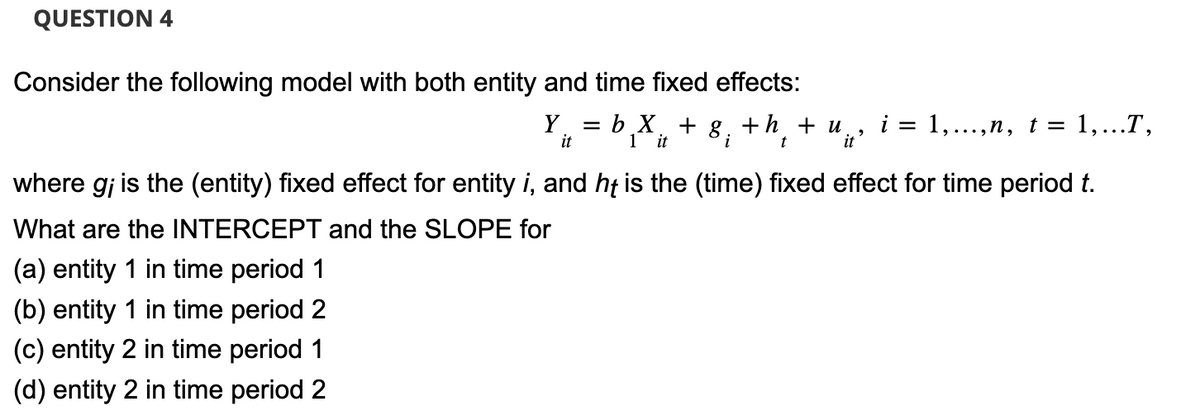
Consider the following model with both entity and time fixed effects: Y =b₁X₁ +8₁ +h₂ +u; i = 1,...,n, t = 1,...T, it 1 it i t where g¡ is the (entity) fixed effect for entity i, and he is the (time) fixed effect for time period t. What are the INTERCEPT and the SLOPE for a) entity 1 in time period 1 b) entity 1 in time period 2 c) entity 2 in time period 1 d) entity 2 in time period 2


Q: The following table lists the prices of a small market basket purchased in both 2012 and 2022.…
A: The importance of cost of living measures is seen day-to-day activities. They are critical in…
Q: 16) The following figure shows the downward sloping demand and marginal revenue [MR] curves and the…
A: A perfectly price-discriminating monopolist is a theoretical concept in economics where a…
Q: ill in the missing values in the table of data collected in the household survey. The working- ge…
A: The labor force is the sum of employed and unemployed people. i.e., Labor force = Employed +…
Q: Calculate Ana's marginal revenue and marginal cost for the first seven teddy bears she produces, and…
A: The total cost incurred by a firm operating in a market includes fixed costs and variable costs.…
Q: The flat line from axis to axis is called a/an Capital N Select one: 56 Labor a. iso-quant curve b.…
A: Isocost lines are similar to that of the budget constraint line showing a different number of inputs…
Q: Complete the following analysis of cost alternatives and select the preferred alternative. The study…
A: Minimum acceptable rate of return as the name suggests is the minimum return an investment is…
Q: 7. Is productive efficiency at value in (f) greatest or least? 8. Demonstrate that the value of SMC…
A: The total cost is the entire sum that must be spent on a production to produce a certain amount of…
Q: Consider the following information regarding PriorityShoes, the athletic shoe company that has…
A: Profit maximization refers to the methodology or objective of a firm to accomplish the most…
Q: Which of the following are reasons why the Fed targets an inflation rate greater than 0%? Inflation…
A: Inflation measures the rate at which the general price level in an economy rises.
Q: 1.. Consider the following GDP data (IMF, WEO Database) China U.S.A. Nominal Real | Nominal Real…
A: Nominal GDP more is the total value of all goods and services that are produced inside its…
Q: The following information relates to a project Year Cash flow Sh. 'Millions' (16) 8 10 1 2 3 4 6 15…
A: To advise management on the optimum time to abandon the project, we need to calculate the Net…
Q: Refer to the diagram above. At the point marked "m," ___________________. Question 11 options: TR…
A: The profit maximizing scenario is considered to be the point where the price equals the marginal…
Q: Tax Exemptions Exemptions allow people to take money out of their paychecks for specific uses before…
A: Tax exemptions refer to specific allowances or deductions that individuals can claim to reduce their…
Q: In Solow model, we assumed that population growth rate is irrelevant to saving rate and…
A: In the slow growth model, technological progress and population growth play critical roles in…
Q: (a) Describe the concept of a (pure strategy) Nash equilibrium; provide an illustrative example.…
A: Nash Equilibrium: In game theory, a Nash equilibrium is a stable in a straegic interaction where no…
Q: Economists use the model of supply and demand to analyze on the market price. Operfect, monopoly…
A: The demand curve illustrates the inverse relationship between price and quantity demanded, keeping…
Q: 2) Current Real GDP = $21.5T Potential Real GDP = $20T MPS = .2 How much would be necessary to close…
A: Recessionary gap refers to the gap between potential output and actual output where actual output is…
Q: How was 1.40331 calculated?
A: INTRODUCTION:The benefit-to-cost ratio serves as an important measure, comparing the present value…
Q: A typical family consumes 53 kg of good X per month, and the current price of X is $14/kg. Due to a…
A: Marginal benefit is the extra gain earned by the consumer when they purchase a good or product. The…
Q: Alternative Annualized first cost, $/year 60,000 90,000 45,000 35,000 110.000 150.000 20,000 45,000…
A: The benefit-cost ratio is a monetary or qualitative statistic that shows how the relative expenses…
Q: In the short-run period, the central Bank can influence the level of interest rates by changing the…
A: A monetary policy is used to affect rates of interest in the economy. These changes impact economic…
Q: Based on the table below, what would the average tax rate be for a person earning $47,000 per year?…
A: Average tax rates show the overall share of income paid in taxes. It is the percentage of the total…
Q: You plan to purchase a car for $28,000. Its market value will decrease by 20% per year. You have…
A: According to the question, the following information is given:
Q: in a global context, does the internet provide opportunities for development with limited…
A: The Internet is one of the important sources for collecting information and communicating the same…
Q: The following graph plots the marginal cost (MC) curve, average total cost (ATC) curve, and average…
A: Decisions about how long to stay in the market and how much to produce must be made by businesses in…
Q: 1. In comparison to a monopolist, is the elasticity of the demand curve more or less elastic than a…
A: Monopolistic competition refers to the market organization in which there are many sellers of a…
Q: Quantity 91, 5 01 Quantity 92, CC W 21 Edgeworth Box 12 I O It is the endowment of good y for person…
A: The Edgeworth-Bowley box is a concept in economics where two individuals and two commodities are…
Q: Below is some data for a hypothetical economy: C=0.56YX=50-0.06Y 1 = 60 T=50+ 0.3Y G=240 Refer to…
A: Marginal propensity to expend (MPE) measures the change in aggregate expenditure (AE) due to change…
Q: In the figure above the firm is suffering negative economic profit. O the firm is operating in a…
A: The monopoly market refers to a market where only one firm exists in the market. A Firm is price…
Q: A rightward shift of the demand curve in a market with an upward-sloping supply curve will lead to…
A: The equilibrium occurs where the demand and supply are equal. The price prevailing at equilibrium…
Q: Calculate the missing information in the table 1.1 taking into consideration that the base year is…
A: The GDP deflator is a measure used to gauge the overall level of prices in an economy relative to a…
Q: The figure on the right shows a pair of budget deficit functions for a country (G+iD-T), denotes the…
A: The budget deficit function, which expresses the difference between government expenditures (G) and…
Q: 1. Consider a consumer with the utility function u(x, y) = 2x¹/2 + y, an income of I = Rs100, and…
A: A utility function is a concept in economics that represents an individual's preferences or…
Q: fer to Figure 8-6. What would happen to producer surplus if the tax were imposed on the =ller? Oa.…
A: The producer surplus refers to gap between actual price a producer receives and minimum price a…
Q: The table shows the supply and demand schedules for pizza. At a price of 13 dollars per pizza, there…
A: Demand curve represents quantity demanded corresponding to different price level. Demand curve is…
Q: Consider the market for electric cars. Suppose that a electric car manufacturing facility dumps…
A: Negative externalities- the cost that is borne by a third party as a result of the production or…
Q: Refer to the table below. Note that the first column shows variable costs. Quantity Cost 0 1 2 3 5 6…
A: The firm will produce where the marginal revenue is equal to marginal cost to maximize its profit.…
Q: Which diagram best represents the problem faced by farms in the short run?
A: Elasticity of demand is a measure of how sensitive the quantity demanded of a good or service is to…
Q: The graph to the right represents the situation of Marguerite's Caps, a firm selling caps in the…
A: A perfect market, also known as an atomistic market, is defined by several idealized conditions,…
Q: Figure 22-13 Price P₁ " 0,0₂ . . . 9₂ . . . . . MC Q₂ AVC ATC Quantity Refer to Figure 22-13. If the…
A: Competitive market is also known as perfect competitive market where large numbers of buyers and…
Q: If the Bank of Canada wanted to reduce inflation, it could Select one: a. increase the reserve…
A: Banking institutions promote fiscal transactions by offering services like deposits and loans, which…
Q: Which of the following statements is true? Select an answer and submit. For keyboard navigation, use…
A: Monopolistic competition refers to a market structure where large numbers of firms dominate the…
Q: For the utility function U = Qx0.42Qy(1-0.42) find the trade-off rate between good X and good Y at…
A: To find the trade-off rate between good X and good Y for the given utility function , we need to…
Q: Price $20 18 16- 14 12 10- 8 100 200 B 300 400 + 500 600 D Quantity Starting at P = $18, if we…
A: Total revenue is the amount obtained by multiplying the price per unit by the quantity of output. It…
Q: 2. Given the utility function U(x; y)=x²y³, and P-3 while P-2, with budget m=100. Measure the MRS,…
A: Note: Since you have posted a question with multiple sub-parts, we will provide the solution only…
Q: 1. A metropolis has only two seasons in a year, one hot and dry season and one warm and wet season.…
A: The demand curve is a curve in economics that depicts the relationship between prices and quantity…
Q: In Akron, 150 people are willing to spend an hour working as yoga instructors for an hourly wage of…
A: A labor supply curve shows the combination of wage rate and quantity of labor supplied. There is a…
Q: include all of the costs of production that increase with the quantity produced. Variable costs…
A: Fixed costs( FC) are expenses that doesn't change with level of production. Fixed costs remain same…
Q: What is one explanation for why this labor supply curve is upward sloping? Firms are willing to hire…
A: The labor market illustrates how the interaction between the employers and the employees determines…
Q: 1. Sources of monopoly power Monopolists, unlike competitive firms, have some market power. A…
A: Market refers to the place or platform where various goods and services are sold and exchanged for…

Step by step
Solved in 3 steps with 9 images


- As a manager of a small software retailing company, you are concerned with projected profit next year. While profit can be determined as the difference between sales and maintenance cost, or in symbols, P = S - M, where P is profit, S is sales, and M is maintenance cost including technical support. It is argues that when sales goes up so does maintenance cost because the cost of technical support will go up. Further, it is measured that the correlation between S and M is 0.8. Now given the figure that sales next year is expected to be $300 thousand with standard deviation of $4 thousand and maintenance cost is expected to be $150 thousand with standard deviation of $6 thousand, what would be the expected profit and its standard deviation you will include in your report?let I(t) be the rate of investment. The total of capital accumulation Kduring the time interval [a,b] can be estimated by the formula in the picture, then calculate a. Total of capital accumulation between 3rd and 8th years given by rate of investment I(t) = 8√t + 0.5 b. Total of capital accumulation between 1st and 4th years given by rate of investment I(t) = ln t2. Give an example of the time inconsistency problem applied to the relationship of a married couple.
- hello i just wanna know if my answer to this question is correct or wrong: Consider five years of monthly pro fit for a company C) Discuss whether a simple exponential smoothing model works well with this data or not. Month Sales Jan-16 747 Feb-16 697 Mar-16 1014 Apr-16 1126 May-16 1105 Jun-16 1450 Jul-16 1639 Aug-16 1711 Sep-16 1307 Oct-16 1223 Nov-16 975 Dec-16 953 Jan-17 1024 Feb-17 928 Mar-17 1442 Apr-17 1371 May-17 1536 Jun-17 2004 Jul-17 1854 Aug-17 1951 Sep-17 1516 Oct-17 1642 Nov-17 1166 Dec-17 1106 Jan-18 1189 Feb-18 1209 Mar-18 1754 Apr-18 1843 May-18 1769 Jun-18 2207 Jul-18 2471 Aug-18 2288 Sep-18 1867 Oct-18 1980 Nov-18 1418 Dec-18 1333 Jan-19 1333 Feb-19 1370 Mar-19 2142 Apr-19 2138 May-19 2078 Jun-19 2960 Jul-19 2616 Aug-19 2861 Sep-19 2237 Oct-19 2225 Nov-19 1590 Dec-19 1659 Jan-20 1613 Feb-20 1605 Mar-20 2349 Apr-20 2468 May-20 2532 Jun-20 3127 Jul-20 3288 Aug-20 3285 Sep-20 2485 Oct-20 2723 Nov-20 1835 Dec-20 1894 here is my answer: Assessing the Applicability of…The following table represents sales data for milk (in hundred liters) sold by a grocery.Do the computations to fill out the table and answer the following questions:1. Using MAD as the criterion, which of the following models would you use for thegiven time series data? Why?A. Naïve approach;B. 5-month SMA model;C. WMA model with weights 0.1, 0.3, and 0.6; orD. ES model with α = 0.5 and a forecast of 3,500 liters in the first month. NOTE: In answering Item 1, mention the whole description of the model; i.e., not just“SMA model”, but “SMA model with n = ...”; not just “WMA model”, but “WMA modelwith weights ...”; not just “ES model”, but “ES model with α = ...”. 2. Interpret the MAD of the most accurate among the forecasting models above.3. Based on your decision in Item 1, what should be the forecast for Month 11?The Results below show the output of the following model: ?=?0+?1?1+?2?2+? Coefficient St. Error t-ratio Intercept 10.492 0.6655 15.77 ?1 0.0154 0.1889 0.08 ?2 0.1353 0.1889 0.72 Observations 100 ?2 0.985 Correlation matrix: X1 X2 X1 1 X2 0.950 1 Instructions: a. The above results show that the model has the problem of multicollinearity, what are the indicators of multicollinearity that can be identified from these results? b. What are the solutions to rectify multicollinearity?
- Hello, please help me to solve the question (c) and (d) below.Consider this regression model (1) : Yt = β0 + β1 Ut + β2 Vt + β3 Wt + β4 Xt + εt ; where t= 1, ..., 75.We use OLS to estimate the parameters, producing the following model:Ŷt = 1.115 + 0.790 Ut − 0.327 Vt + 0.763 Wt + 0.456 Xt (0.405) (0.178) (0.088) (0.274) (0.017) Given that:R2 = 0.941; Durbin Watson stat DW = 1.907; RSS = 0.0757.(To answer the question, use the 5% level of significance, state clearly H0 and H1 that are tested, the test statistics that are used, and interpret the decisions.) (a) Describe the concepts of unbiasedness and efficiency. State the conditions required of regression (1) in order that the OLS estimators of the model parameters possess these properties. (b) Perform the following tests on the parameters of regression (1): (i) test whether the parameters β1, β2, β3 and β4 are individually statistically significant; (ii) test the overall significance of the regression model;…Consider the following numerical example of the IS-LM model: C= 100 + 0.3Yd ; I = 150 + 0.2Y – 1000 i ; G = 200 ; T = 100. Derive the IS relation. I've got the answer written down as =400+0.5Y-500i can someone please provide solutions as to how it is this.Hello. May I ask how did you get the values? Were those only assumed values? Can you also explain how did you make the normal form thoroughly?
- Q2B. Which of the following are limitations of using Impulse Response Functions(IRFs) in time series analysis?i. IRFs are only valid for linear time series models.ii. IRFs assume that the underlying time series is stationary.iii. IRFs can provide information about the short-term dynamics of the relationshipbetween variables, but they do not capture longer-term effects or otherimportant aspects of the relationship.iv. IRFs depend on the specification of the model used to estimate the relationshipbetween variables.21. Consider a firm subject to quarter-to-quarter variation in its sales. Suppose that the following equation was estimated using quarterly data for the period 2011–2018 (the time variable goes from 1 to 32). The variables D1, D2, and D3 are, respectively, dummy variables for the first, second, and third quarters (e.g., D1 is equal to 1 in the first quarter and 0 otherwise). Qt =a+bt+c1D1+c2D2+c3D3 The results of the estimation are presented here: a. Calculate the intercept in each of the four quarters. What do these values imply? b. Use this estimated equation to forecast sales in the fourth quarter of 2019.In the past four years, the annual returns of one company’s stockare 12%, 18%, and –14%, and 7%.a) What is the geometric average return? b) What is the arithmetic average of the returns? c) According to an economist’ forecast on the Year 2020, the probabilities of repeatingthe performances of the former four years are 30%, 30%, 20%, and 20%, respectively.What is the expected return of the stock in the Year 2020